
DAS Tool
Metagenomic BinningDAS Tool is an automated method for optimizing metagenome-assembled genome (MAG) recovery by integrating the results of multiple binning algorithms. It selects the best non-redundant set of bins from several input binners using single-copy gene (SCG) analysis. [1]
How to Obtain Output Model File
Below is a brief workflow the team ran to obtain the output model examples we present on the tools page.
Input
Contig-to-bin mapping files from multiple binners (TSV) + assembled contigs (FASTA)
Output
TSV with per-bin scores: bin_set (source binner), SCG completeness/redundancy, bin_score, genome size, N50, contig count
conda install -c bioconda das_tool
Docker image: nanozoo/das_tool:latest
Sample 1 activated sludge metagenome (SRR36893531, 24.6M read pairs) assembled with Assembly, binned with MetaBAT2, MaxBin2, and CONCOCT, then optimized with DAS Tool.
- 1
Download reads from NCBI SRA
prefetch SRR36893531 && fasterq-dump SRR36893531 -O /data --split-files && gzip /data/SRR36893531_*.fastq
Illumina NovaSeq X Plus, 2×151 bp paired-end, 24,649,901 read pairs.
- 2
Assemble with MEGAHIT
megahit -1 reads_1.fastq.gz -2 reads_2.fastq.gz -o megahit_assembly --min-contig-len 1000 -t 12
Produces 46,957 contigs, 106.9 Mbp, N50=2,500 bp.
- 3
Map reads to contigs
minimap2 -ax sr -t 12 final.contigs.fa reads_1.fastq.gz reads_2.fastq.gz | samtools sort -@ 8 -o mapped.bam && samtools index mapped.bam
- 4
Bin with MetaBAT2, MaxBin2, and CONCOCT
jgi_summarize_bam_contig_depths --outputDepth depth.txt mapped.bam && metabat2 -i final.contigs.fa -a depth.txt -o metabat2_bins/bin -m 1500 -t 8
Run each binner independently, then convert outputs to contig-to-bin TSV mappings using Fasta_to_Contig2Bin.sh. MetaBAT2: 19 bins, MaxBin2: 29 bins, CONCOCT: 75 bins.
- 5
Run DAS Tool
DAS_Tool -i metabat2.tsv,maxbin2.tsv,concoct.tsv -l MetaBAT2,MaxBin2,CONCOCT -c final.contigs.fa -o dastool/DASToolRun --write_bin_evals --write_bins -t 8 --score_threshold 0 --search_engine diamond
Evaluates all bins from all 3 binners and selects the best non-redundant set using single-copy gene analysis.
DASToolRun_allBins.eval to IntMetaMaterials Used
Sample Output Files
Download the output files used in the tool page demos. You can upload these directly to IntMeta to explore the visualizations.
Single & Comparison
Group Analysis
Charts Reference
Detailed descriptions for all 30 visualizations generated by DAS Tool in IntMeta.
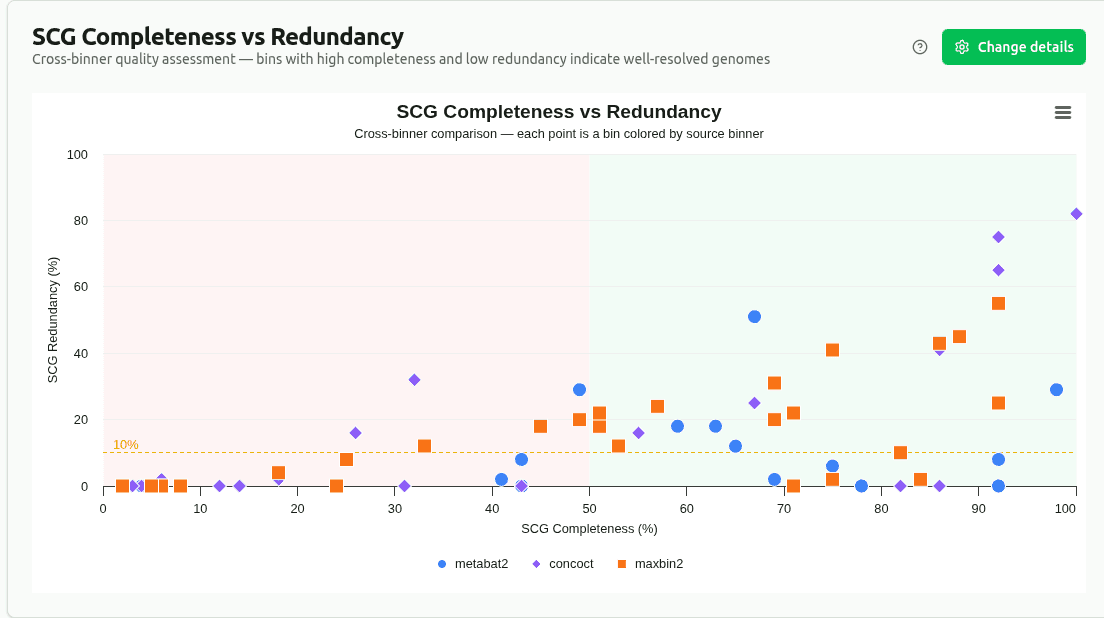
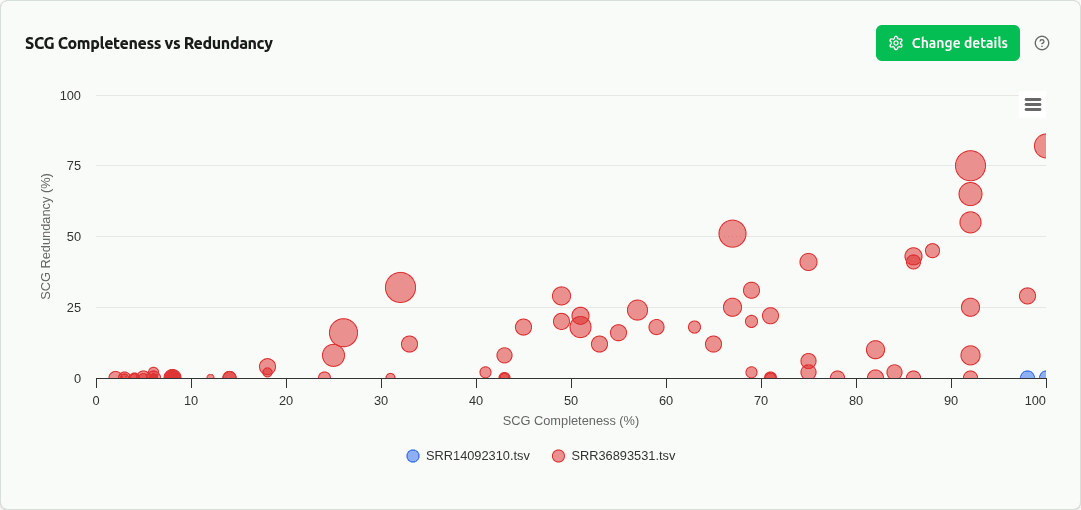
scg-completeness-vs-redundancy
Scatter plot of SCG_completeness (fraction of expected single-copy genes found) vs SCG_redundancy (fraction found more than once), colored by source binner (bin_set column). Ideal bins cluster bottom-right: high completeness, low redundancy. Enables cross-binner comparison.

bin-score-ranking
Bar chart ranking bins by DAS Tool bin_score, a composite metric based on the ratio of unique to total single-copy genes. Selection cutoff shown as a dashed line (adjustable) — bins scoring above it were selected for the final non-redundant set.
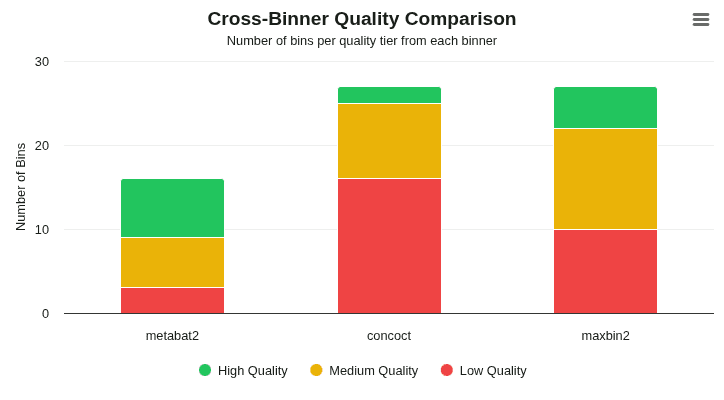
cross-binner-quality
Grouped bar chart comparing quality tier distribution (High ≥0.5 / Medium ≥0.1 / Low <0.1 bin_score) across source binners. Reveals which binning algorithm contributes the most high-quality bins to the DAS Tool consensus set.
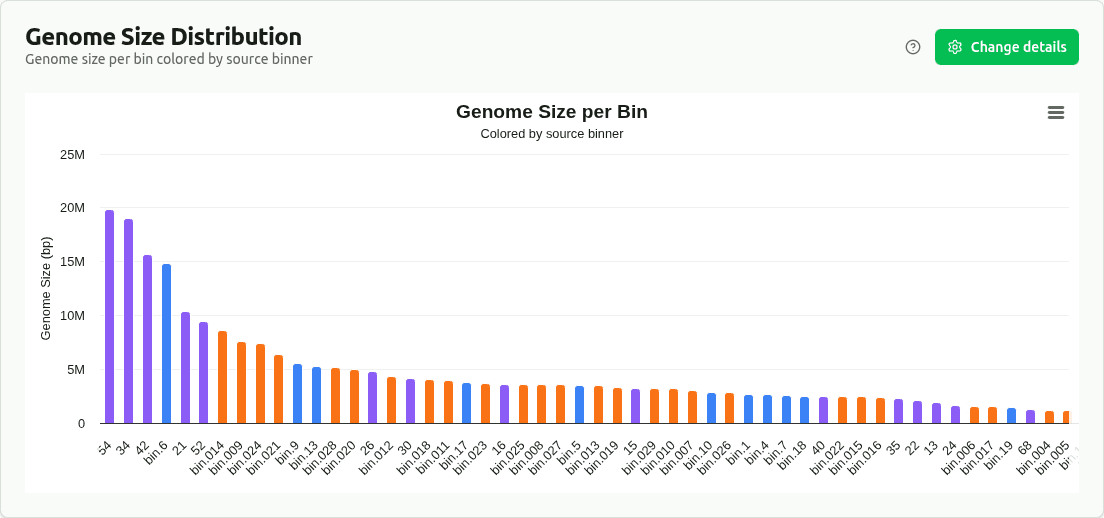
genome-size-distribution
Bar chart of genome size (Mbp, from the 'size' column) per bin, colored by source binner (bin_set). Enables comparison of bin size distributions across different binning algorithms.
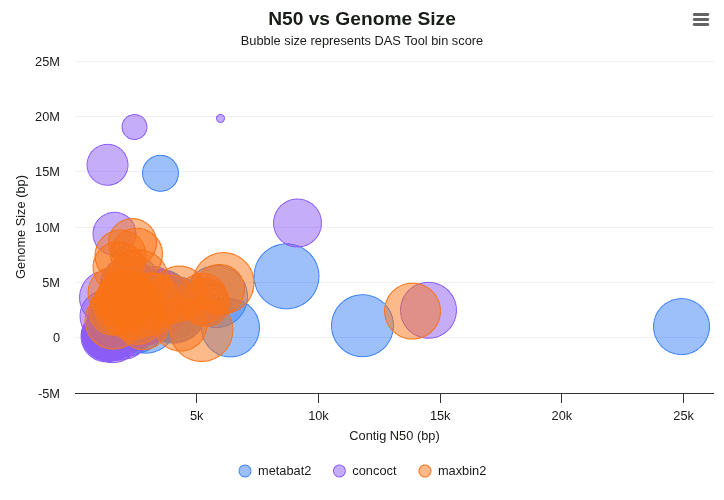
n50-vs-genome-size
Bubble plot where X = genome size, Y = N50, and bubble diameter = bin_score. Larger, top-right bubbles represent the highest-quality, best-assembled genomes in the consensus set.
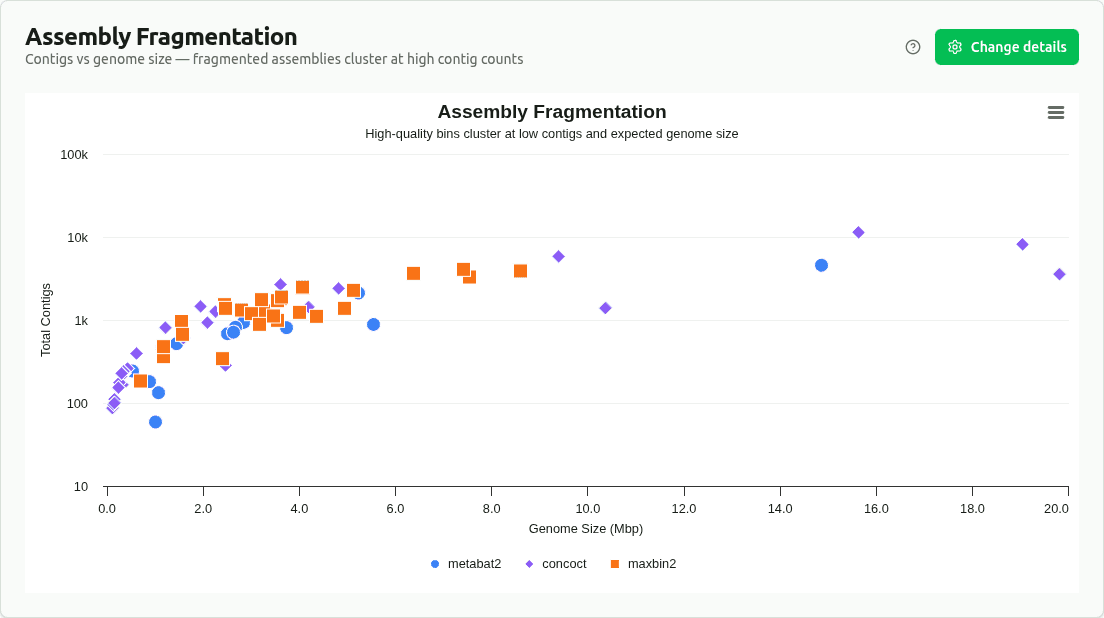
assembly-fragmentation
Scatter plot of contig count vs genome size, colored by source binner. Identifies which binners produce more or less fragmented assemblies — upper-left means many small contigs, lower-right means fewer, larger contigs.
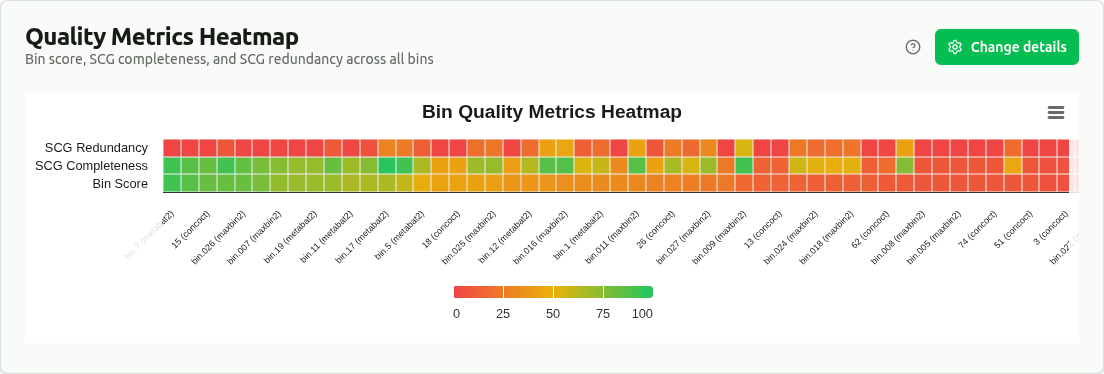
quality-metrics-heatmap
Heatmap of min-max normalized bin_score, SCG_completeness, and SCG_redundancy for all bins. Each metric is scaled 0–1 within its column. Provides a compact overview to quickly identify outlier bins and quality patterns across the dataset.
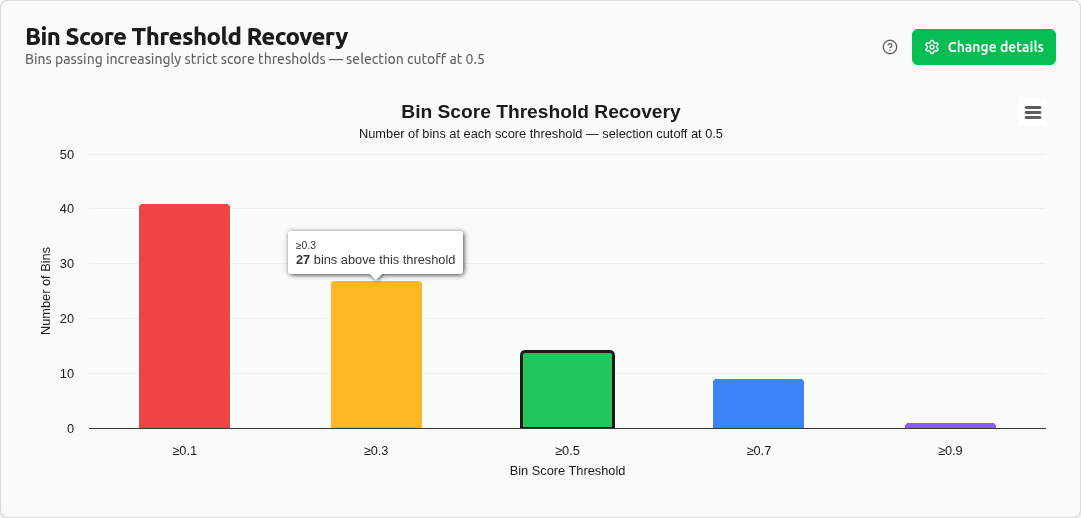
score-threshold-recovery
Bar chart showing how many bins pass increasingly strict bin_score thresholds (≥0.1, ≥0.3, ≥0.5, ≥0.7, ≥0.9). Selection cutoff is adjustable via the settings panel. Used in the original DAS Tool paper to demonstrate recovery performance across quality levels.
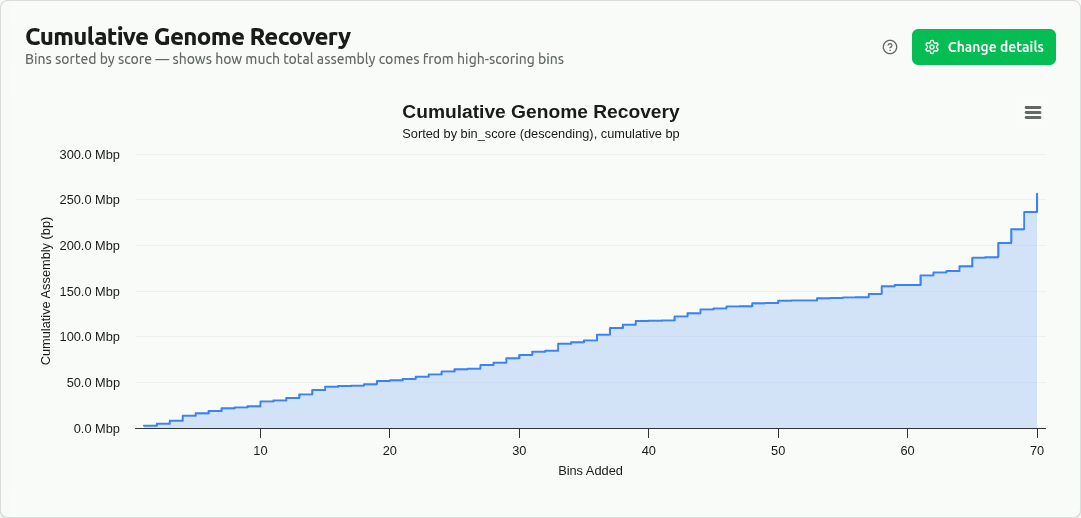
cumulative-genome-recovery
Cumulative step-area plot with bins sorted by bin_score (descending). Y-axis shows running total of genome size in bp. A steep initial rise indicates most assembled sequence comes from high-scoring bins in the DAS Tool consensus set.
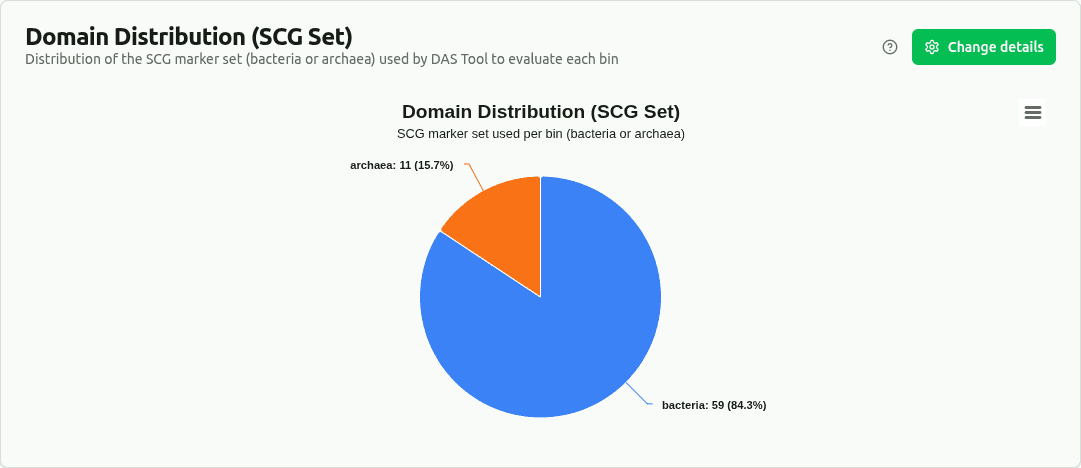
domain-distribution
Pie chart of bins grouped by SCG_set column — the single-copy gene marker set (bacteria or archaea) that DAS Tool selected for scoring each bin. Bins evaluated with the archaeal set likely represent archaeal MAGs.

comp-quality-tiers
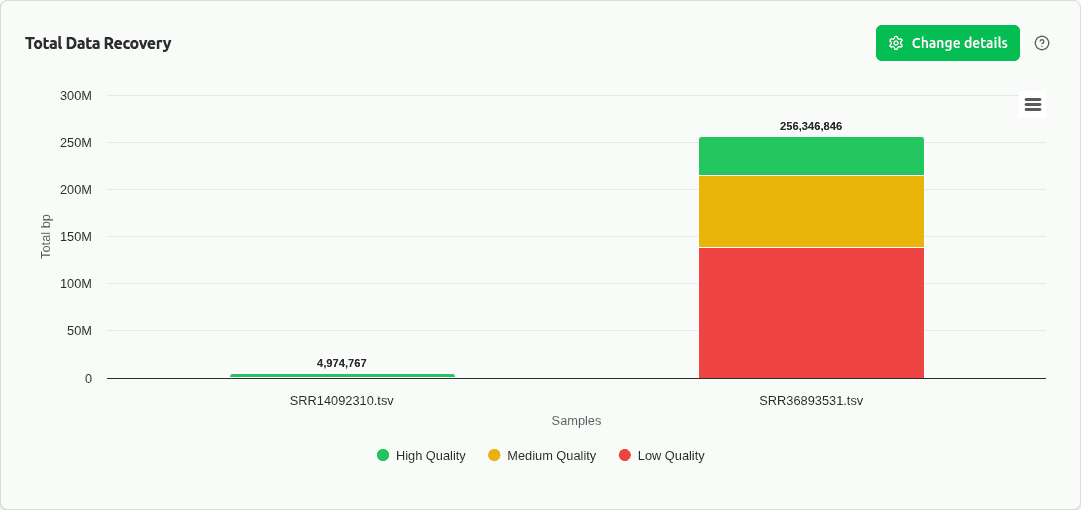
Grouped bar chart comparing quality tier distribution (High ≥0.5 / Medium ≥0.1 / Low <0.1 bin_score) across samples. Reveals which sample's DAS Tool consensus set achieved the best overall bin quality.

comp-genome-size
Box plot or grouped bar chart comparing the genome size distribution of DAS Tool-selected bins across samples. Differences may reflect varying community complexity or assembly quality between samples.
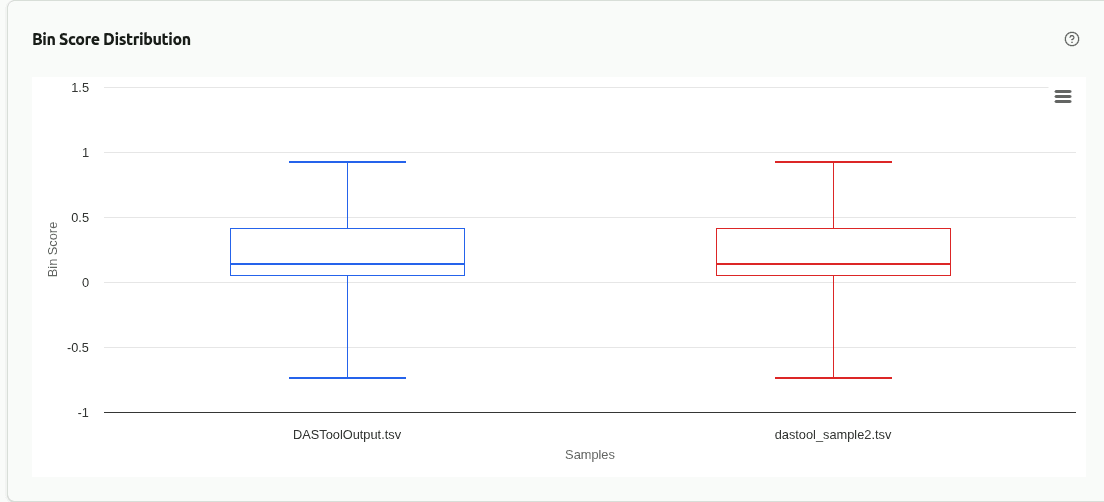
comp-score-distribution
Box plot or histogram comparing the distribution of DAS Tool bin scores across samples. Higher median scores indicate better single-copy gene recovery and less redundancy in the consensus bin set.
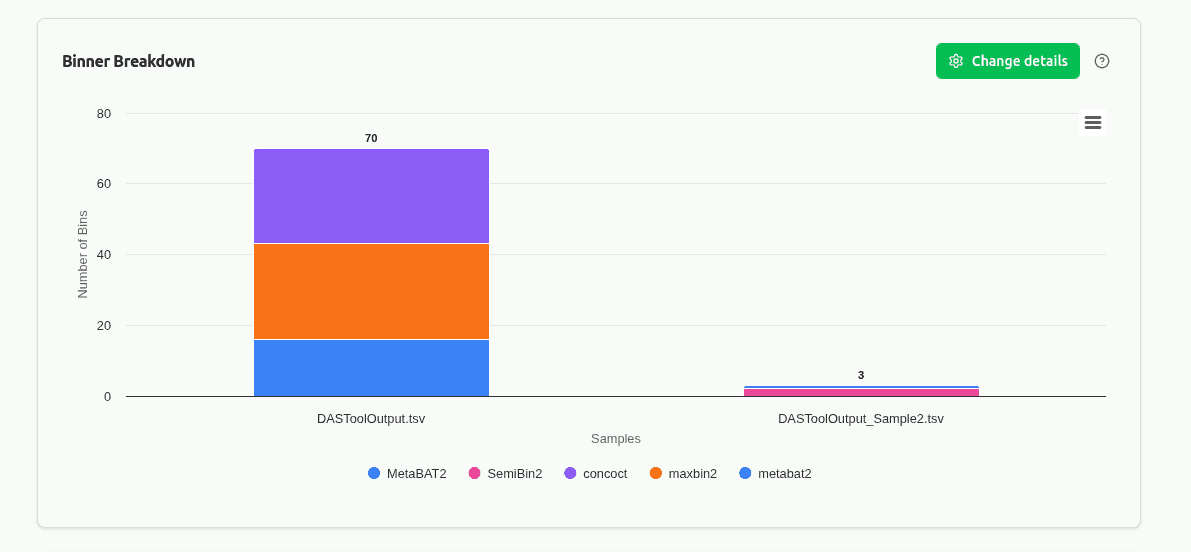
comp-binner-breakdown
Stacked or grouped bar chart showing the contribution of each source binner (e.g., MetaBAT2, MaxBin2, CONCOCT) to the DAS Tool consensus set per sample. Reveals which binning algorithm performs best in each sample context.
comp-scg-scatter
Cross-sample scatter of SCG completeness vs redundancy from DAS Tool consensus scoring. Each dot is a selected bin, colored by sample. Reveals how bin refinement quality varies across samples.
comp-quality-pct
100% stacked bar chart showing the proportion of High / Medium / Low quality bins per sample. Normalizes for different bin counts, enabling direct comparison of MAG recovery quality. Standard in CAMI challenge benchmarks.
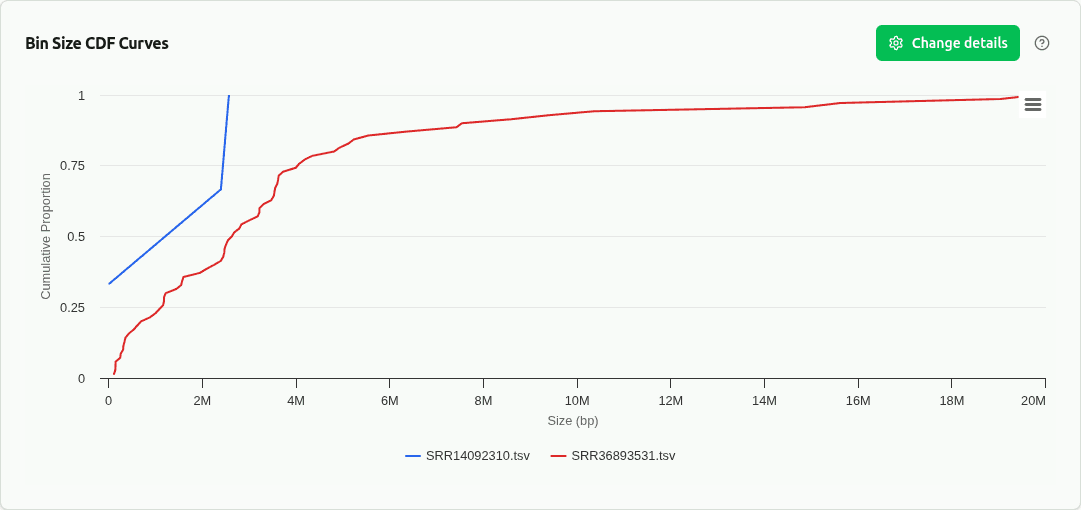
comp-cdf
Empirical cumulative distribution function (CDF) of bin sizes overlaid per sample. Reveals full distribution shape beyond boxplot summaries — tails, bimodality, and what fraction of bins exceed size thresholds. Standard in CAMI benchmarking.
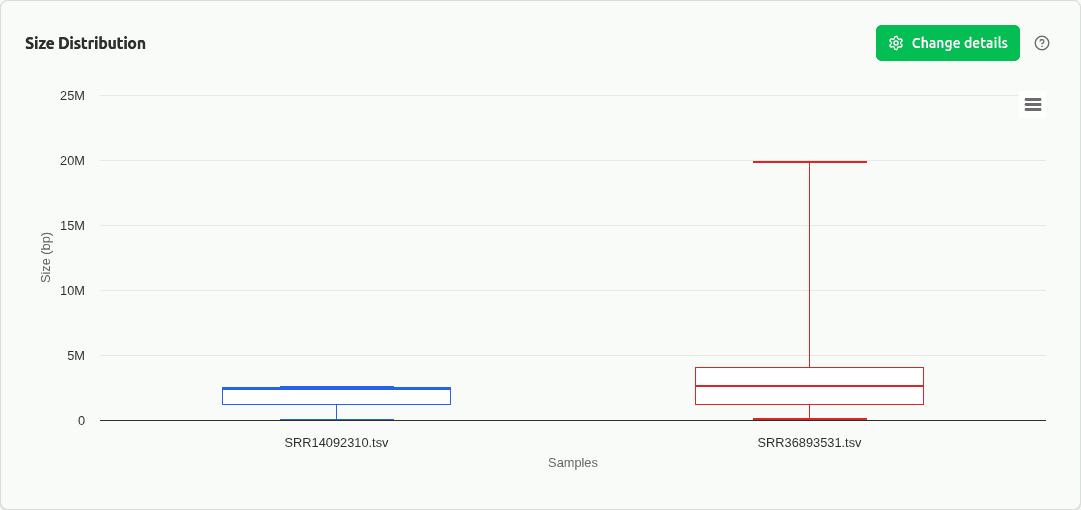
comp-size
Boxplot of bin genome size distribution across samples. Reveals systematic differences in MAG sizes that may reflect community composition or sequencing depth variation.
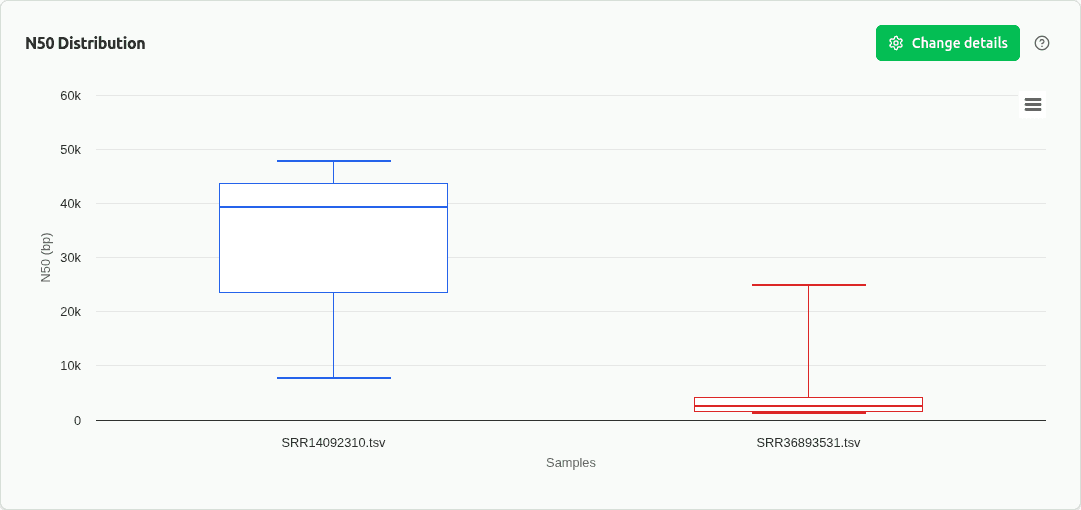
comp-n50
Boxplot of N50 assembly contiguity metric across samples. Higher N50 indicates larger contiguous sequences within bins, reflecting better assembly quality.
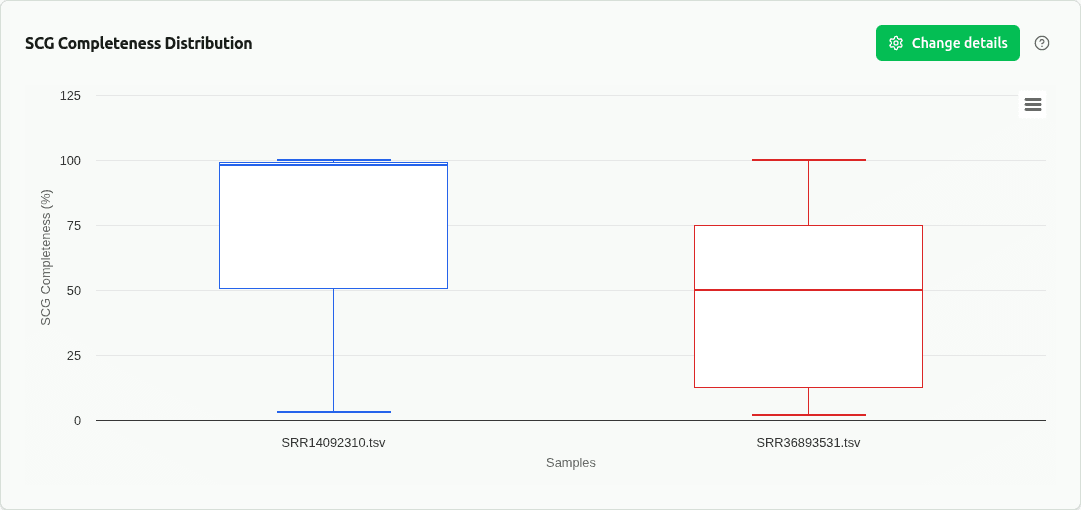
comp-scg-completeness
Boxplot of single-copy gene (SCG) completeness across samples. Based on DAS Tool SCG analysis using bacterial/archaeal marker gene sets.
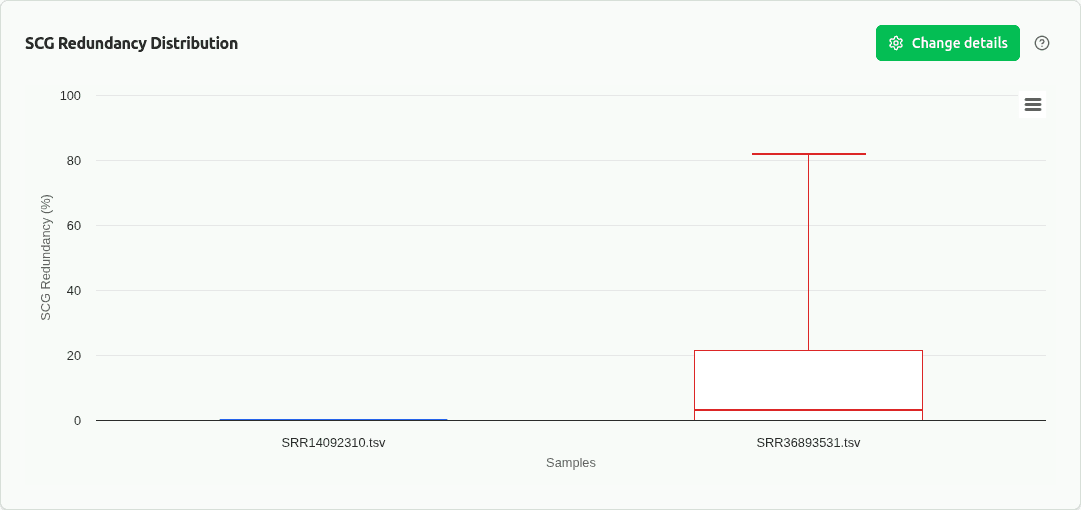
comp-scg-redundancy
Boxplot of SCG redundancy (%) across samples. Measures contamination via duplicated single-copy marker genes. Lower is better — values >10% indicate significant contamination.

binning-group-quality-tiers
Grouped bar chart of quality tier counts (High ≥0.5 / Medium ≥0.1 / Low <0.1 bin_score) per experimental group, with Chi-square test for independence. The 0.5 score threshold is the default DAS Tool selection cutoff. Significant p-values indicate groups differ in overall bin quality.

binning-group-metric-boxplots
Boxplots comparing a selected metric (bin_score, SCG completeness, SCG redundancy, N50, or genome size) across groups. All individual bin values are pooled per group. Kruskal-Wallis test (≥3 groups) or Mann-Whitney U test (2 groups) assesses significance; pairwise comparisons use Benjamini-Hochberg FDR correction.

binning-group-recovery-rate
Grouped bar chart of mean bin count per sample at each quality tier (High, Medium, Low, Total) across groups, with ±1 SD error bars. Tests whether experimental groups differ in how many MAGs they recover at each quality level.

binning-group-pca
PCA ordination of per-sample quality profiles (mean bin_score, SCG completeness, SCG redundancy, N50, genome size, %HQ, %MQ). Features are z-score standardized before decomposition. PERMANOVA on the Euclidean distance matrix tests whether group centroids differ significantly. 95% confidence ellipses are drawn for groups with ≥3 samples.

binning-group-cdf
Overlaid empirical cumulative distribution functions (CDFs) of a selected metric across groups. The two-sample Kolmogorov-Smirnov test quantifies the maximum vertical distance between curves — significant D-statistics indicate the groups' metric distributions differ in location, spread, or shape.
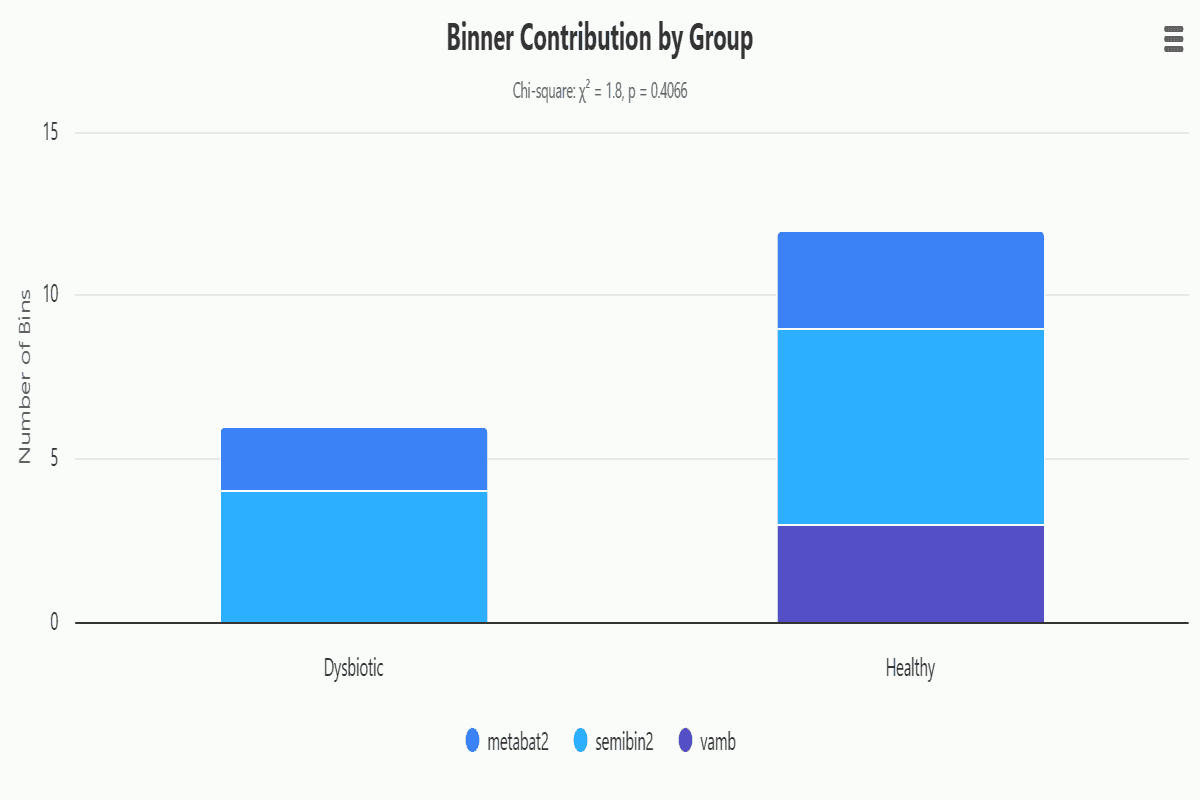
binning-group-binner-contribution
Stacked bar chart of bin counts by source binner (bin_set column, e.g. MetaBAT2, MaxBin2, CONCOCT) per group, with Chi-square test. Reveals whether certain experimental conditions favor specific binning algorithms in the DAS Tool consensus selection.

binning-group-scatter
Cross-group scatter overlay of SCG completeness vs redundancy, colored by group. Shows whether experimental groups produce systematically different bin refinement quality profiles. Based on DAS Tool SCG analysis.

binning-group-total-recovery
Stacked bar chart of mean total base pairs recovered per group, split by quality tier. Error bars show ±1 SD. Measures actual data volume binned per group, complementing bin count and recovery rate charts.