
Fully view your data
Explore all available visualizations across our 12 supported tools
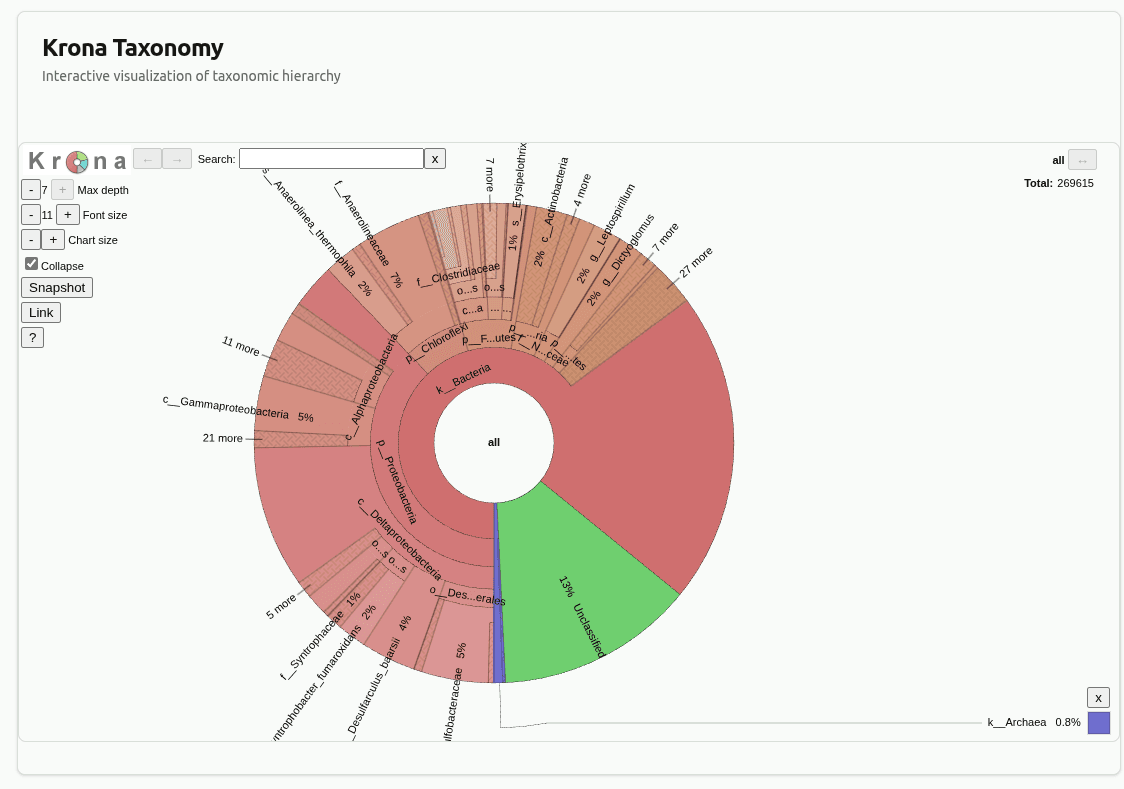
Krona Taxonomy Explorer
Interactive zoomable radial taxonomy explorer — drill into any lineage from domain to species.
Kraken style, CLARK, Kaiju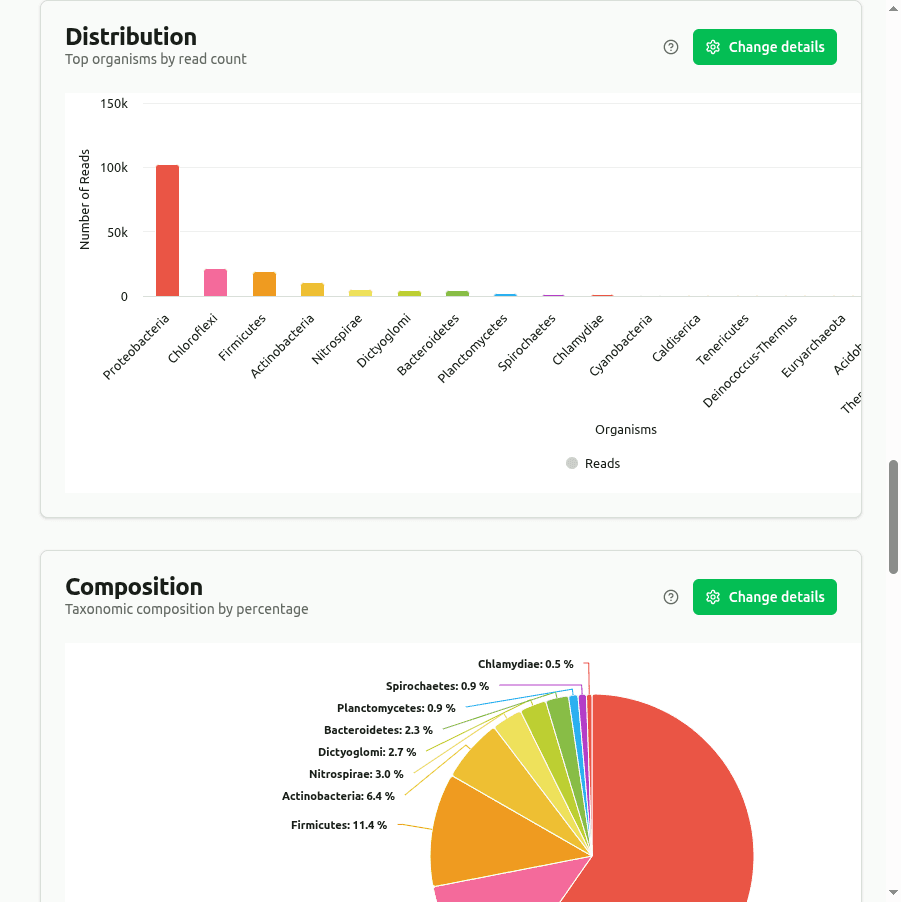
Distribution
Top organisms ranked by read count in a colorful bar chart.
Kraken style, CLARK, Kaiju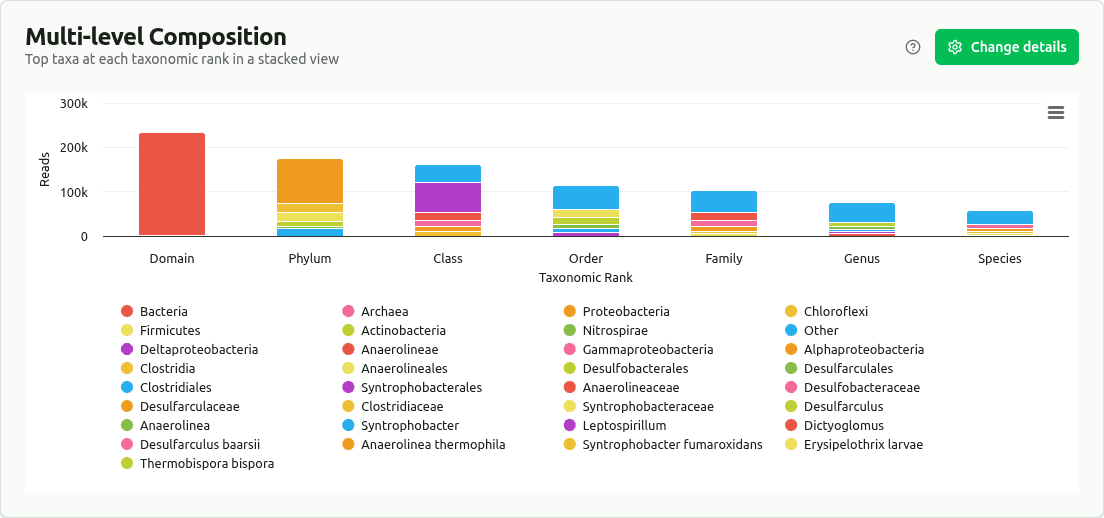
Multi-level Composition
Top taxa at each rank in a stacked bar view.
Kraken style, CLARK, Kaiju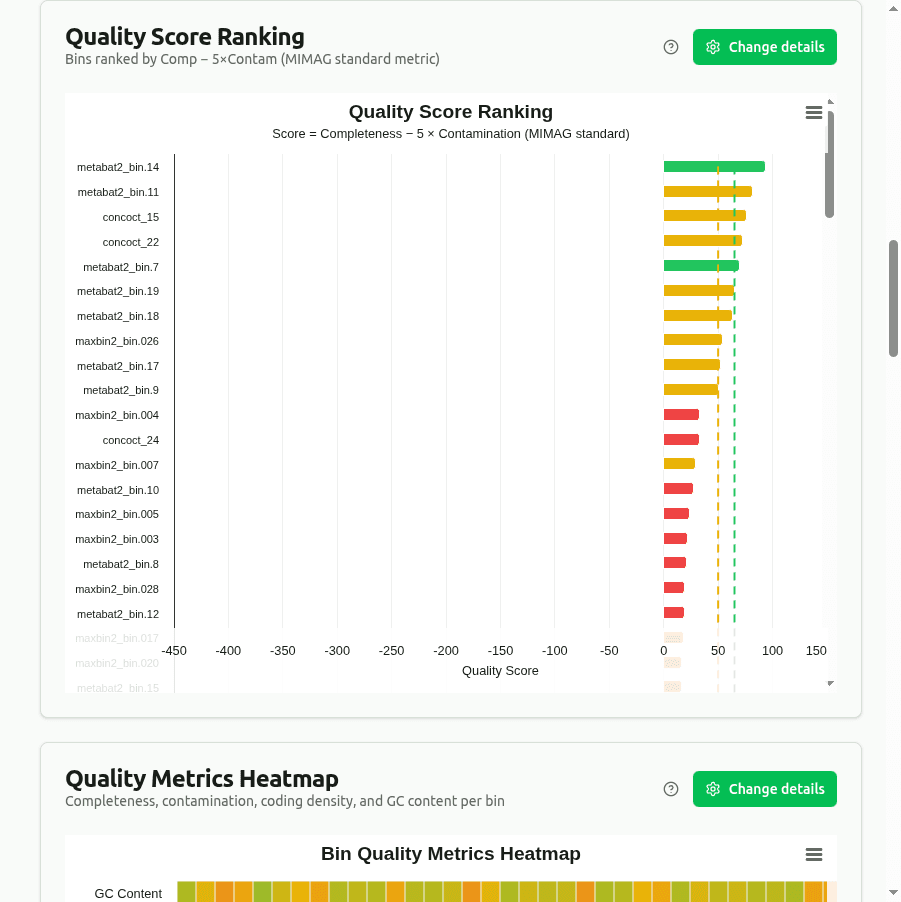
Quality Score Ranking
Bins ranked by Comp − 5×Contam (MIMAG standard metric).
CheckM2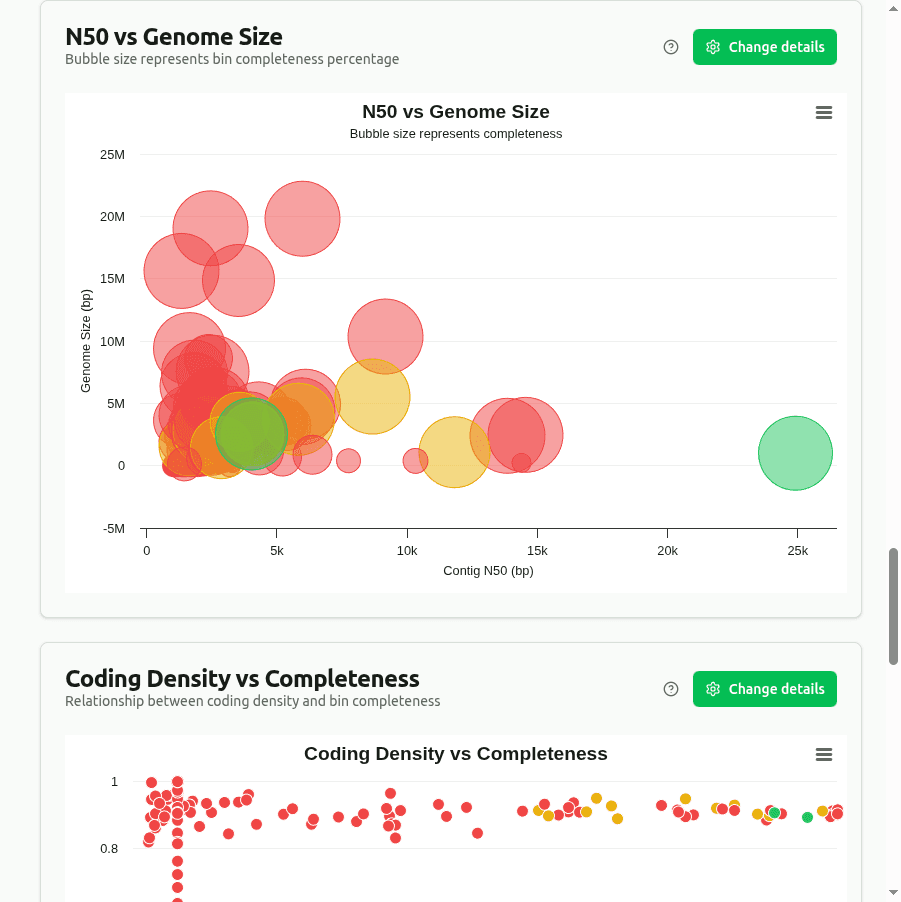
N50 vs Genome Size
Bubble size represents bin completeness percentage.
CheckM2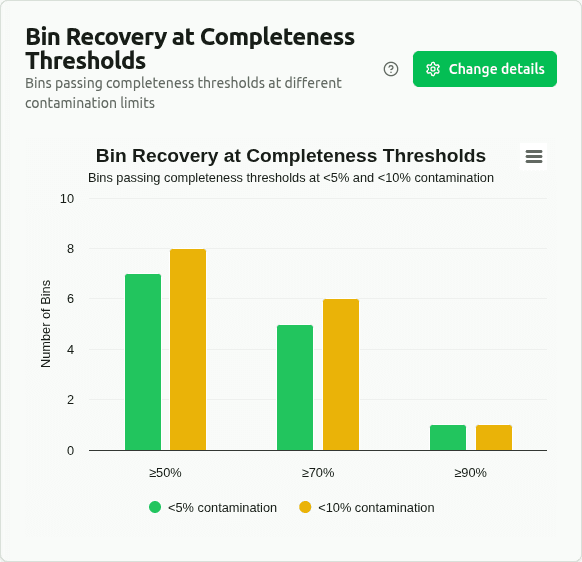
Completeness Threshold Recovery
Bins passing ≥50%/≥70%/≥90% completeness at contamination cutoffs.
CheckM2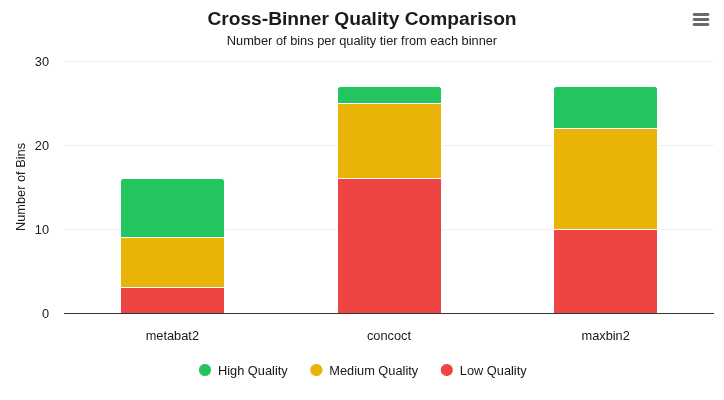
Cross-Binner Quality Comparison
Compare bin quality tiers across multiple binning tools — see which binner produces the best genomes.
DAS Tool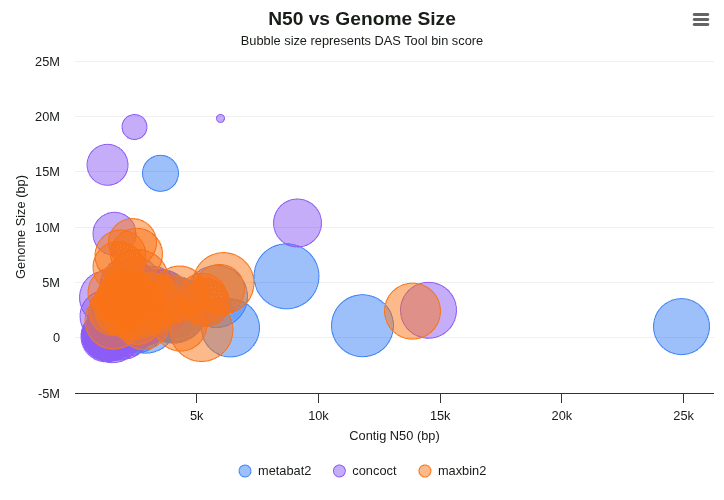
N50 Bubble Chart
N50 vs genome size — bubble size reflects bin score.
DAS Tool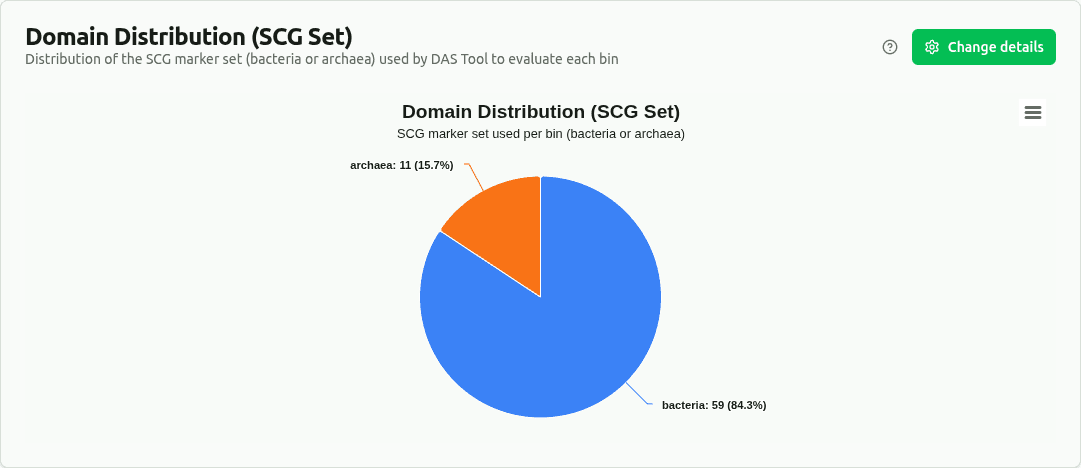
Domain Distribution
Bacteria vs archaea bins based on SCG marker gene set selection.
DAS Tool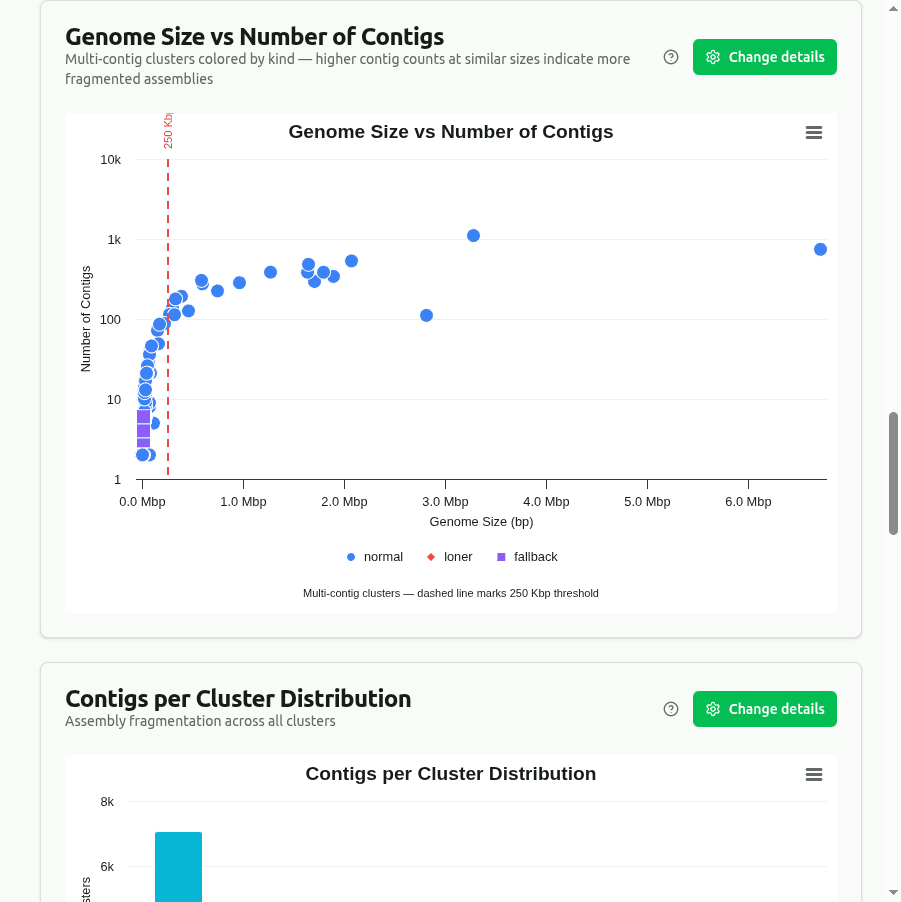
Genome Size vs Contigs
Multi-contig clusters colored by kind.
VAMB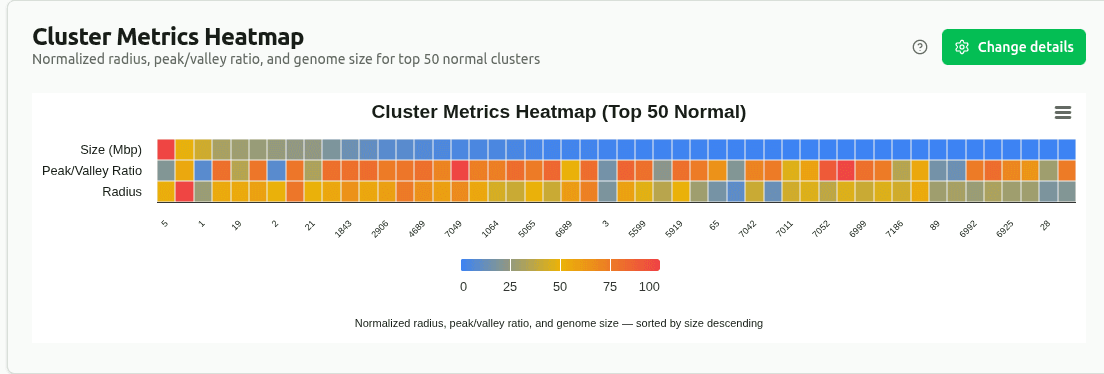
VAMB Heatmap
Normalized radius, PVR, and genome size for top 50 normal clusters.
VAMB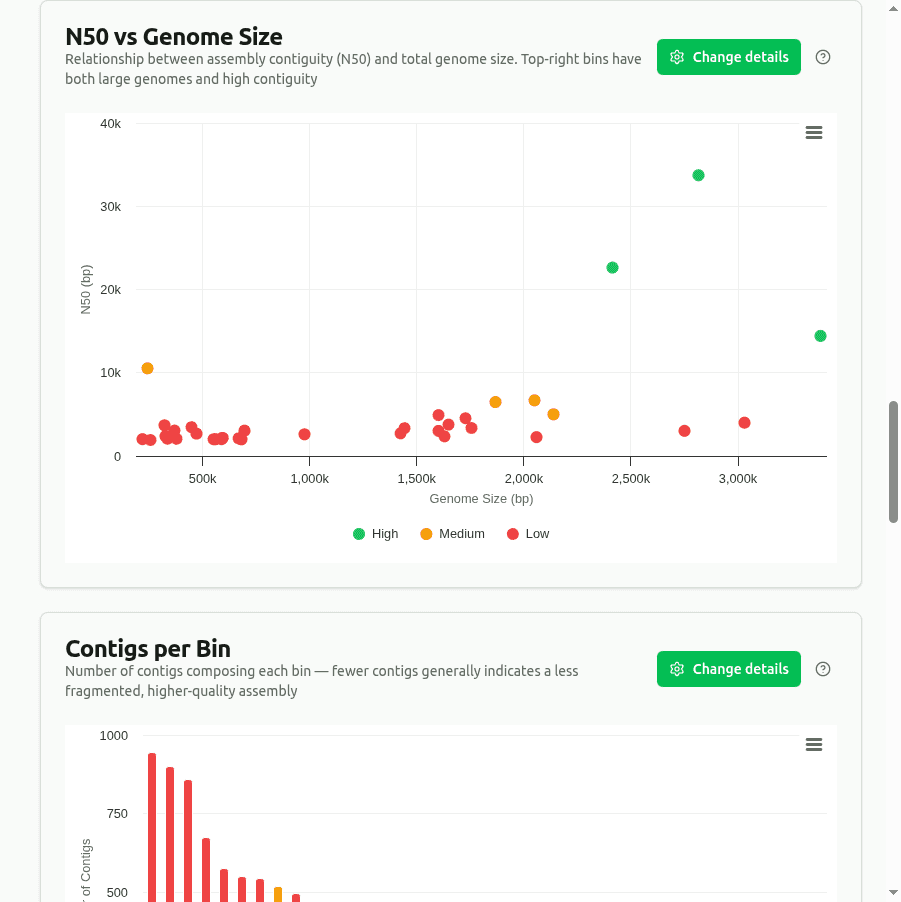
SemiBin2 N50 vs Size
Assembly contiguity vs genome size colored by quality tier.
SemiBin2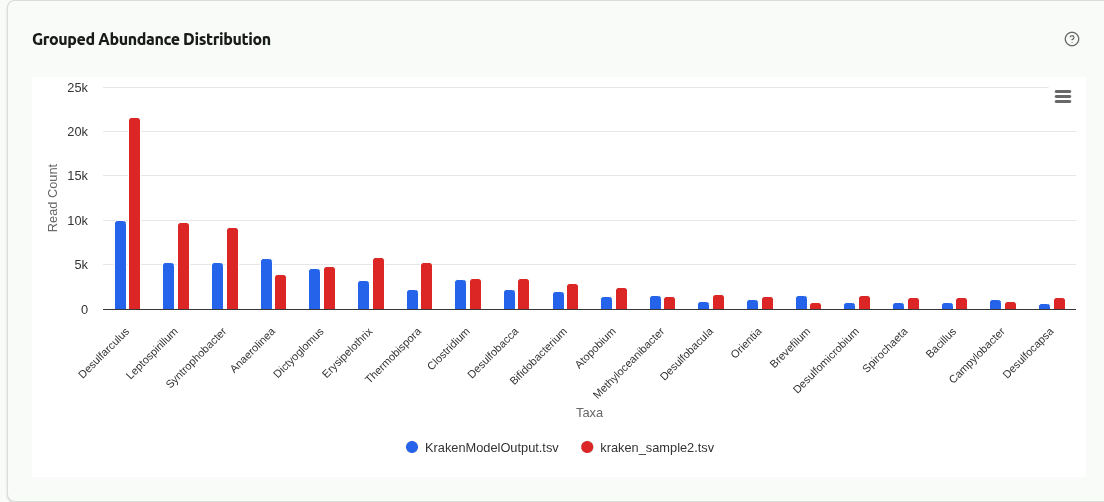
Grouped Abundance
Side-by-side abundance comparison of top taxa across samples.
Kraken style, CLARK, Kaiju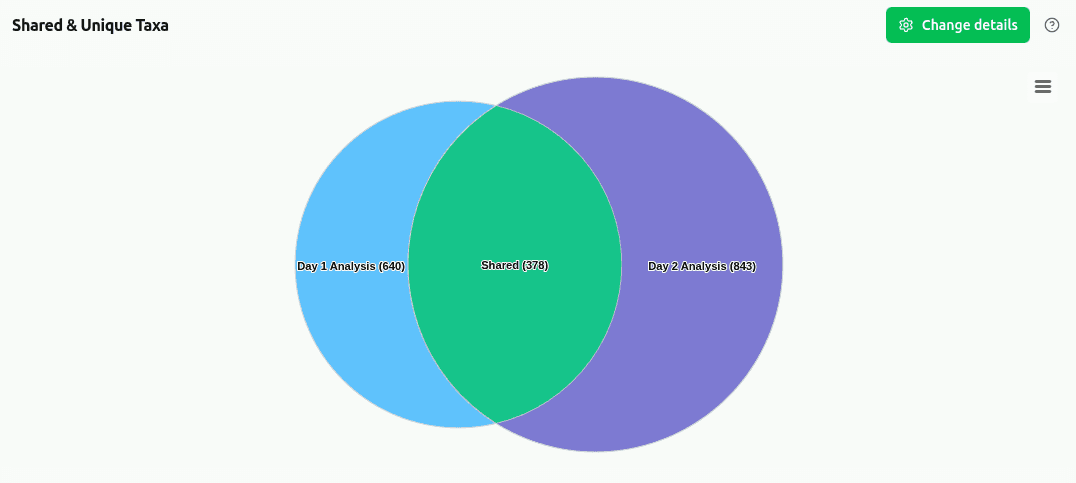
Shared & Unique Taxa
Venn diagram showing shared and exclusive taxa between samples.
Kraken style, CLARK, Kaiju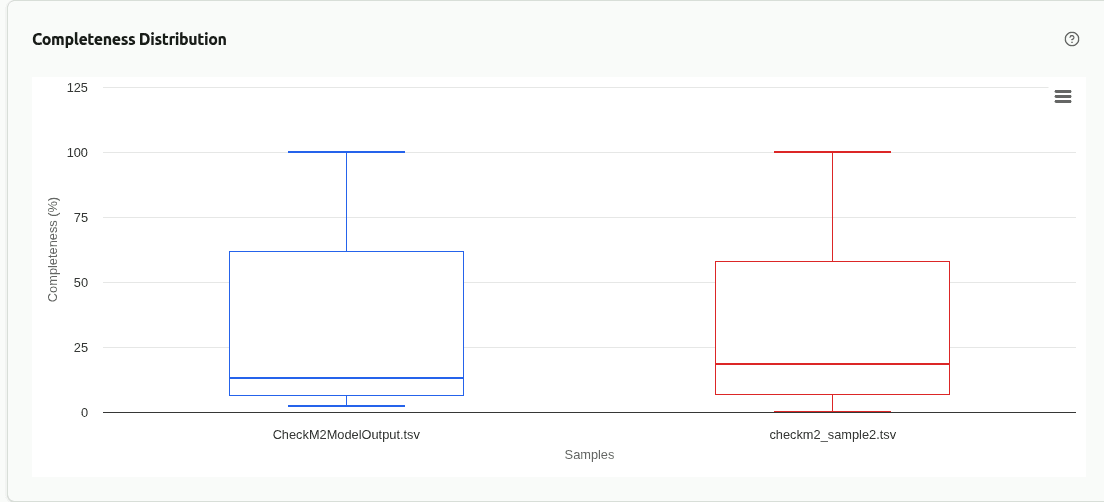
Contamination Distribution
Contamination percentage distribution compared across samples.
CheckM2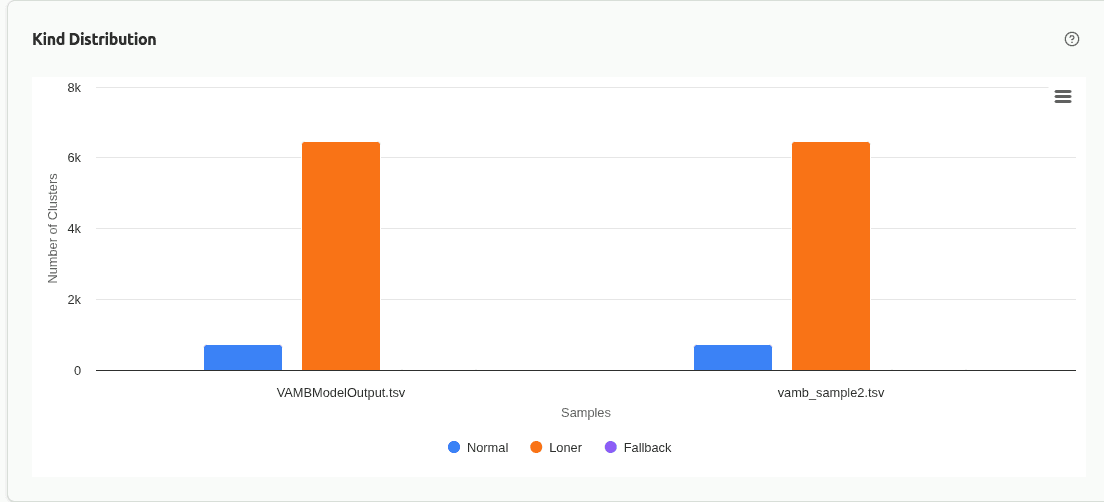
Kind Distribution
Normal, loner, and fallback cluster distribution across samples.
VAMB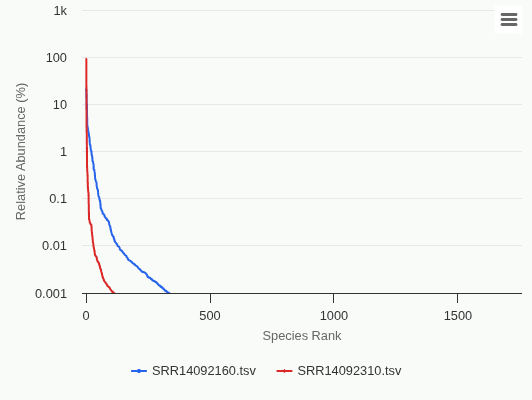
Rank Abundance Comparison
Overlaid rank-abundance curves — steeper slopes indicate more uneven communities.
Kraken style, CLARK, Kaiju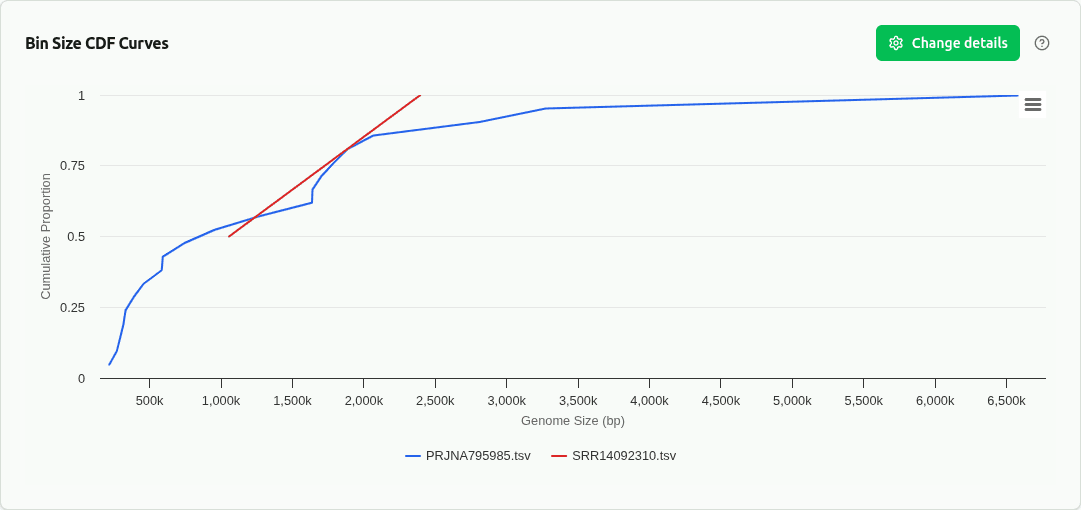
CDF Comparison
Empirical cumulative distribution of bin sizes overlaid per sample.
CheckM2, DAS Tool, VAMB, SemiBin2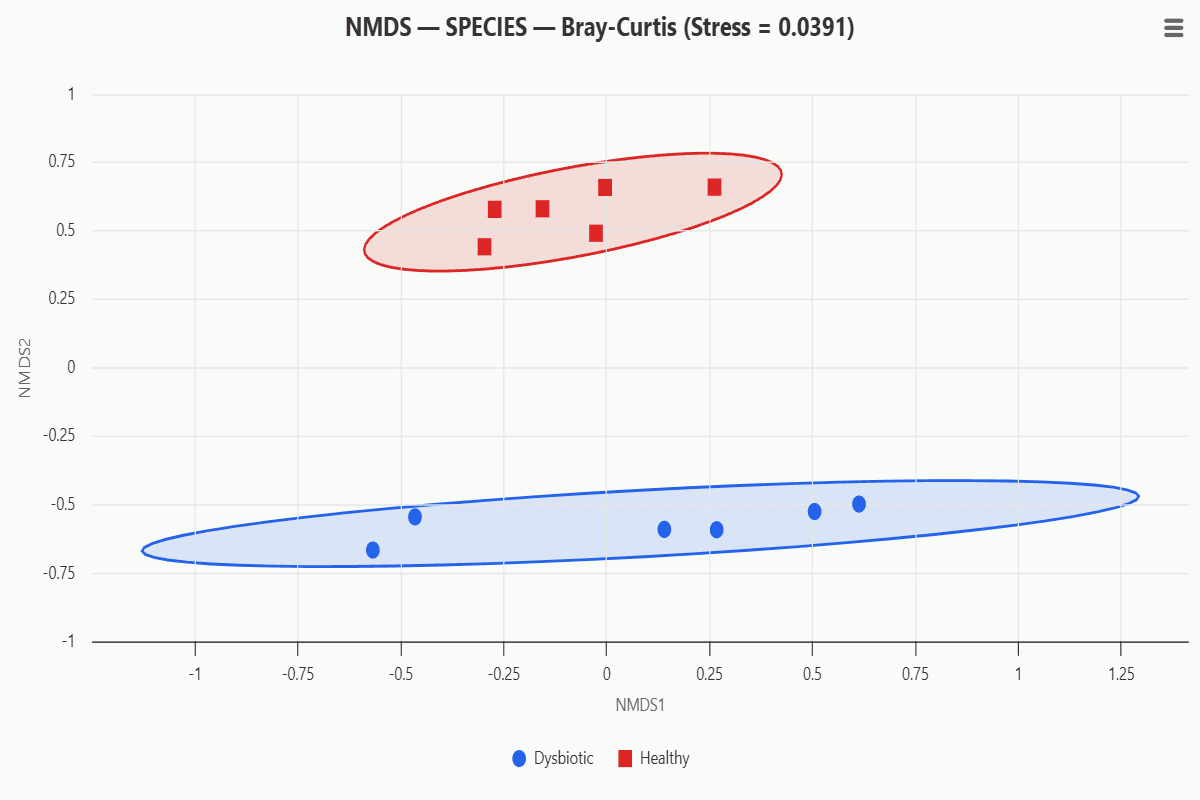
NMDS Ordination
Non-metric Multidimensional Scaling with stress value and group confidence ellipses.
Kraken style, CLARK, Kaiju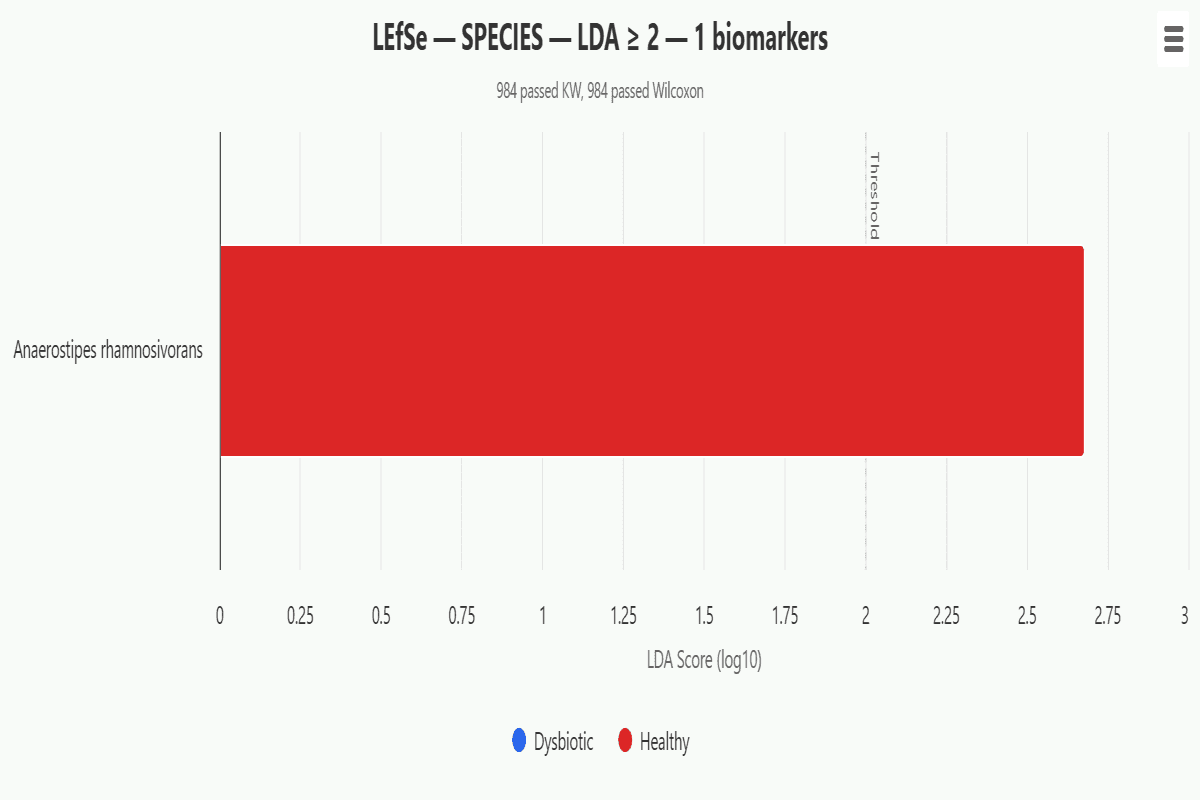
LEfSe Biomarkers
Linear Discriminant Analysis Effect Size identifying taxa that best characterize each group.
Kraken style, CLARK, Kaiju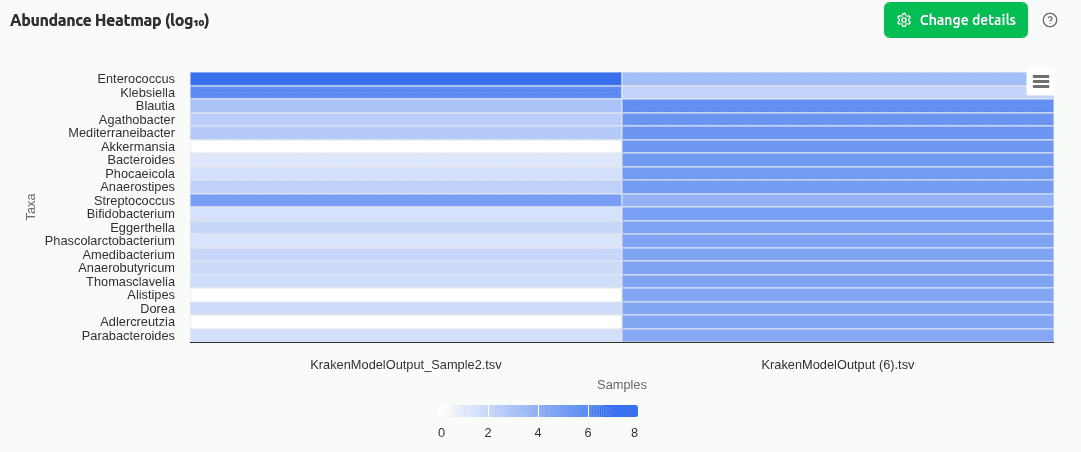
Abundance Heatmap by Group (log₁₀)
Heatmap of mean log₁₀-transformed read counts with groups on the X-axis and taxa on the Y-axis.
Kraken style, CLARK, Kaiju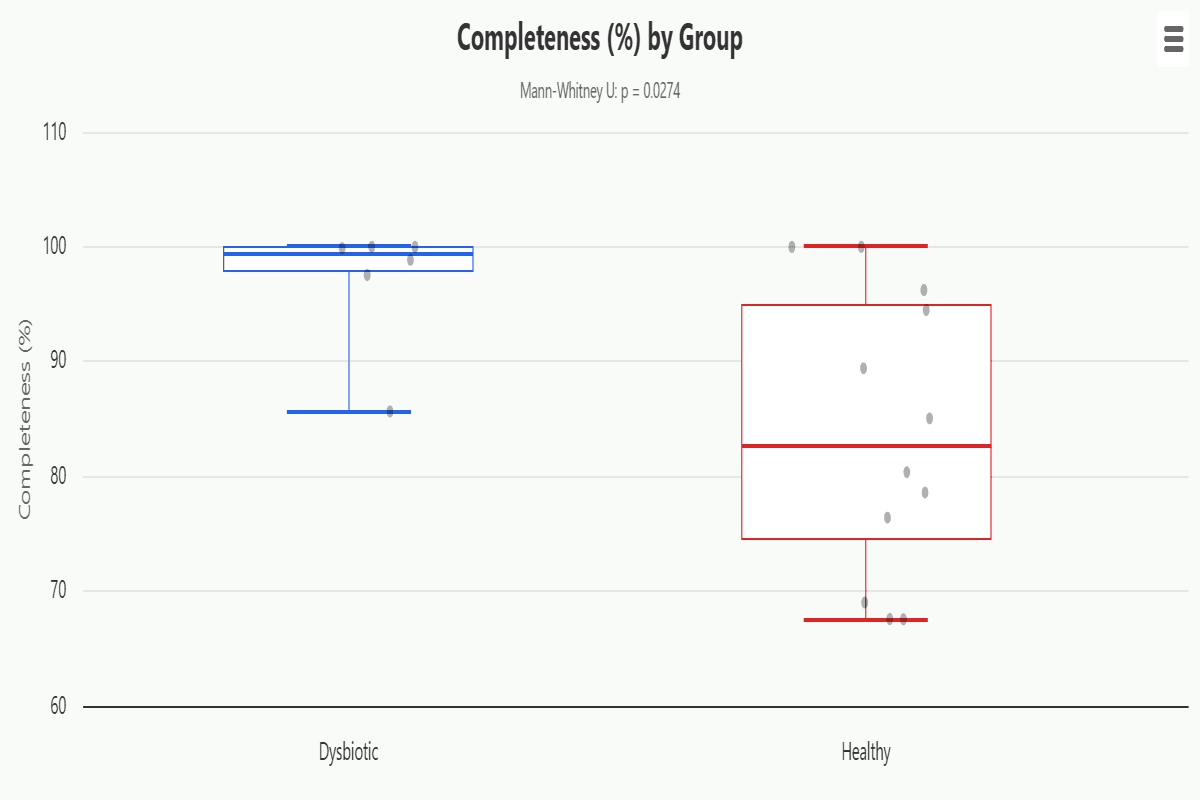
Metric Boxplots by Group
Boxplots comparing quality metrics across groups with Mann-Whitney U or Kruskal-Wallis tests.
CheckM2, DAS Tool, VAMB, SemiBin2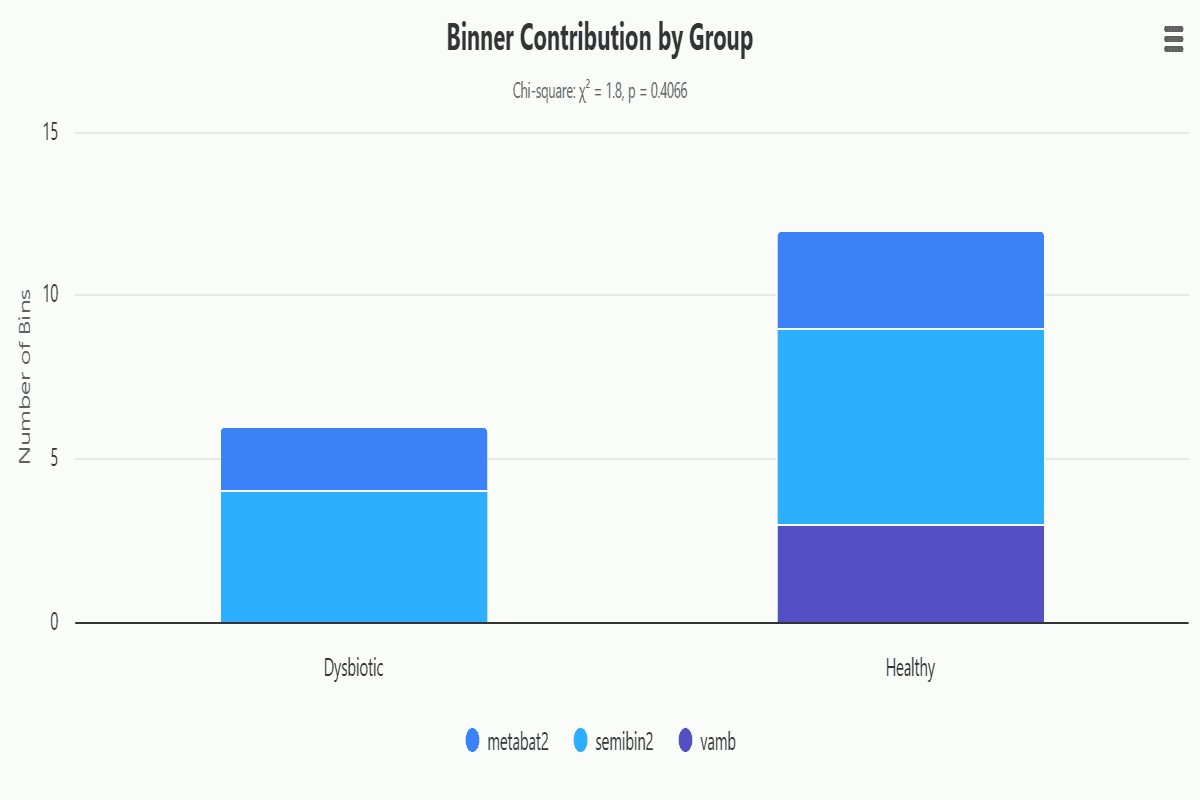
Binner Contribution by Group
Stacked bar chart of bin counts by source binner per group with Chi-square test.
DAS Tool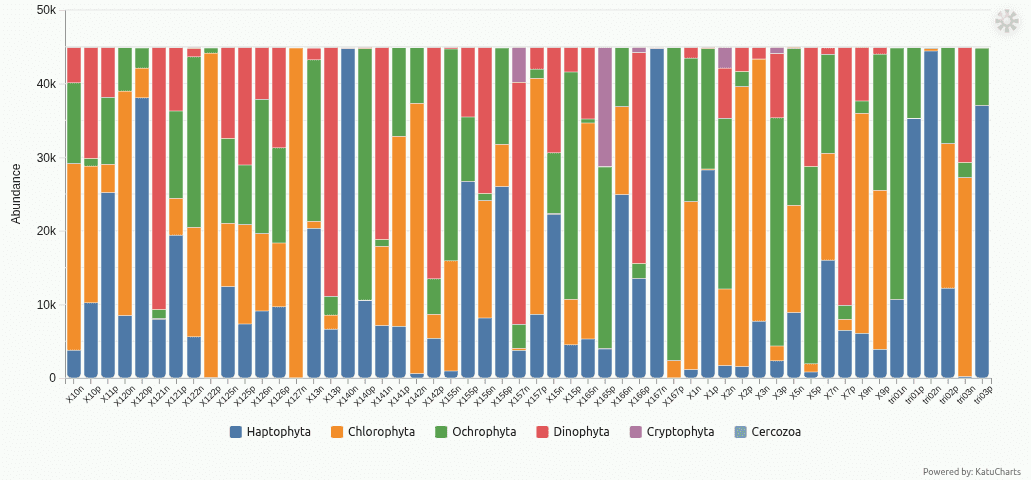
Community Composition
Per-sample stacked bars of relative abundance at any taxonomic rank, mergeable by a metadata variable.
Microbiome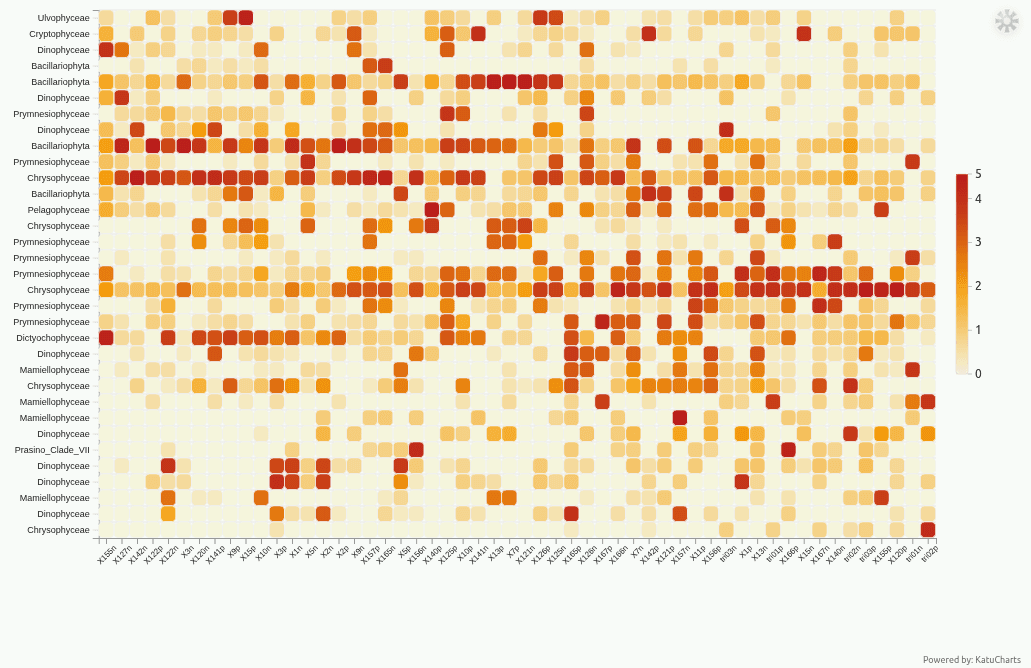
Abundance Heatmap
Most abundant taxa across samples, ordination-ordered so co-occurring taxa and similar samples sit together.
MicrobiomeKrona Taxonomy Explorer
Interactive zoomable radial taxonomy explorer — drill into any lineage from domain to species.
Kraken style, CLARK, KaijuDistribution
Top organisms ranked by read count in a colorful bar chart.
Kraken style, CLARK, KaijuMulti-level Composition
Top taxa at each rank in a stacked bar view.
Kraken style, CLARK, KaijuQuality Score Ranking
Bins ranked by Comp − 5×Contam (MIMAG standard metric).
CheckM2N50 vs Genome Size
Bubble size represents bin completeness percentage.
CheckM2Completeness Threshold Recovery
Bins passing ≥50%/≥70%/≥90% completeness at contamination cutoffs.
CheckM2Cross-Binner Quality Comparison
Compare bin quality tiers across multiple binning tools — see which binner produces the best genomes.
DAS ToolN50 Bubble Chart
N50 vs genome size — bubble size reflects bin score.
DAS ToolDomain Distribution
Bacteria vs archaea bins based on SCG marker gene set selection.
DAS ToolGenome Size vs Contigs
Multi-contig clusters colored by kind.
VAMBVAMB Heatmap
Normalized radius, PVR, and genome size for top 50 normal clusters.
VAMBSemiBin2 N50 vs Size
Assembly contiguity vs genome size colored by quality tier.
SemiBin2Grouped Abundance
Side-by-side abundance comparison of top taxa across samples.
Kraken style, CLARK, KaijuShared & Unique Taxa
Venn diagram showing shared and exclusive taxa between samples.
Kraken style, CLARK, KaijuContamination Distribution
Contamination percentage distribution compared across samples.
CheckM2Kind Distribution
Normal, loner, and fallback cluster distribution across samples.
VAMBRank Abundance Comparison
Overlaid rank-abundance curves — steeper slopes indicate more uneven communities.
Kraken style, CLARK, KaijuCDF Comparison
Empirical cumulative distribution of bin sizes overlaid per sample.
CheckM2, DAS Tool, VAMB, SemiBin2NMDS Ordination
Non-metric Multidimensional Scaling with stress value and group confidence ellipses.
Kraken style, CLARK, KaijuLEfSe Biomarkers
Linear Discriminant Analysis Effect Size identifying taxa that best characterize each group.
Kraken style, CLARK, KaijuAbundance Heatmap by Group (log₁₀)
Heatmap of mean log₁₀-transformed read counts with groups on the X-axis and taxa on the Y-axis.
Kraken style, CLARK, KaijuMetric Boxplots by Group
Boxplots comparing quality metrics across groups with Mann-Whitney U or Kruskal-Wallis tests.
CheckM2, DAS Tool, VAMB, SemiBin2Binner Contribution by Group
Stacked bar chart of bin counts by source binner per group with Chi-square test.
DAS ToolCommunity Composition
Per-sample stacked bars of relative abundance at any taxonomic rank, mergeable by a metadata variable.
MicrobiomeAbundance Heatmap
Most abundant taxa across samples, ordination-ordered so co-occurring taxa and similar samples sit together.
Microbiome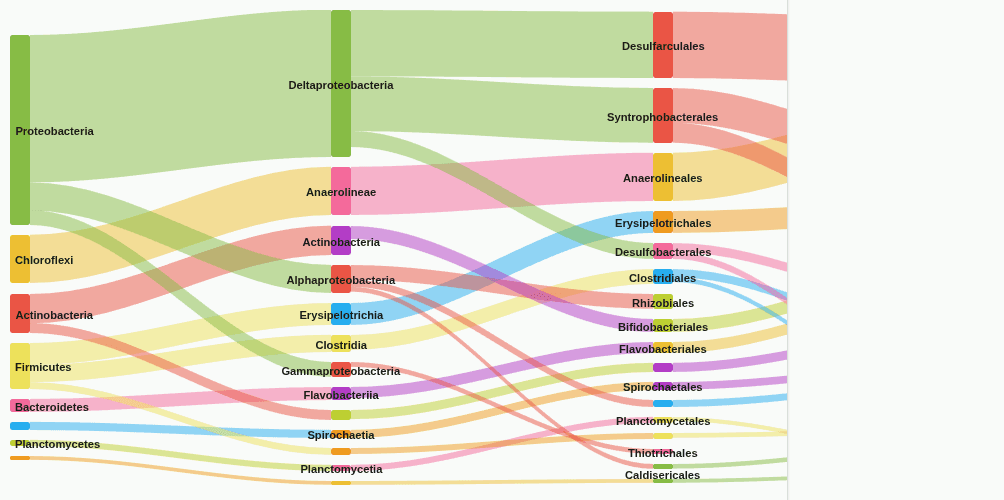
Taxonomic Composition Flow
Follow the hierarchical flow of reads through Sankey diagrams from phylum to family level.
Kraken style, CLARK, Kaiju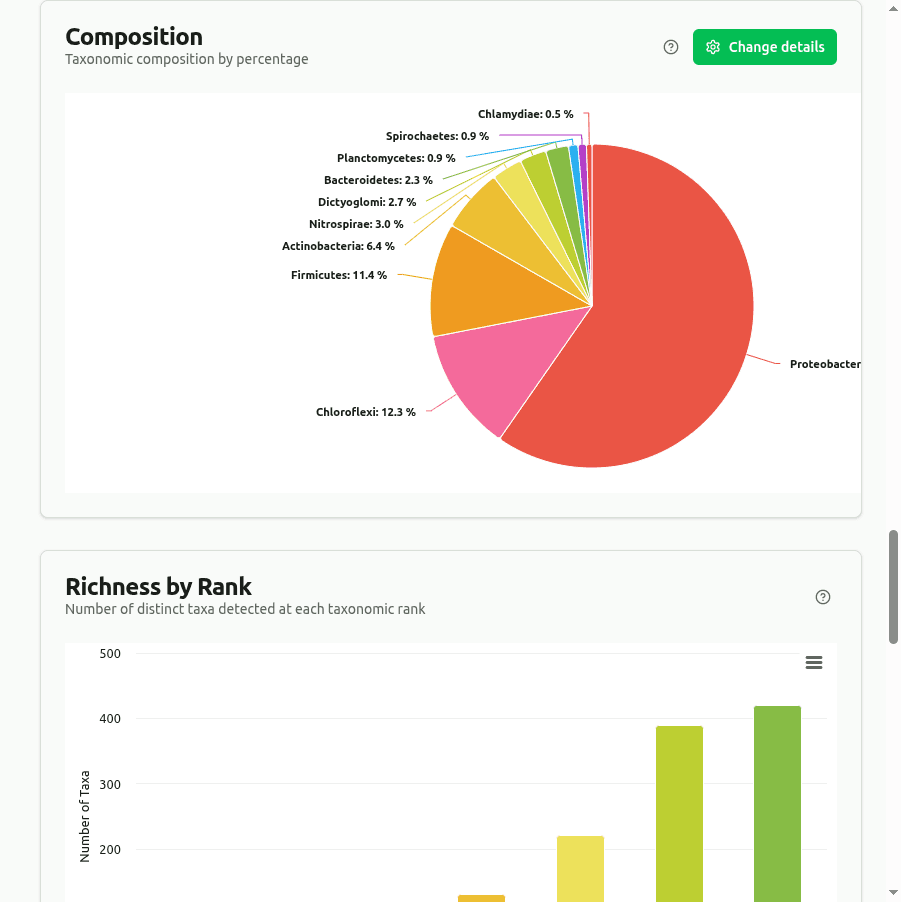
Composition
Pie/donut chart of taxonomic composition by percentage.
Kraken style, CLARK, Kaiju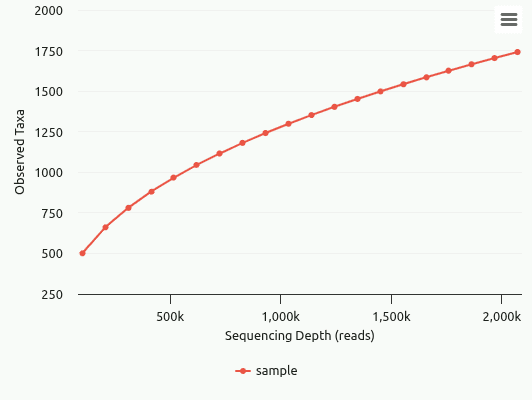
Rarefaction Curve
Observed taxa vs subsampled read depth — plateau indicates sufficient sequencing depth.
Kraken style, CLARK, Kaiju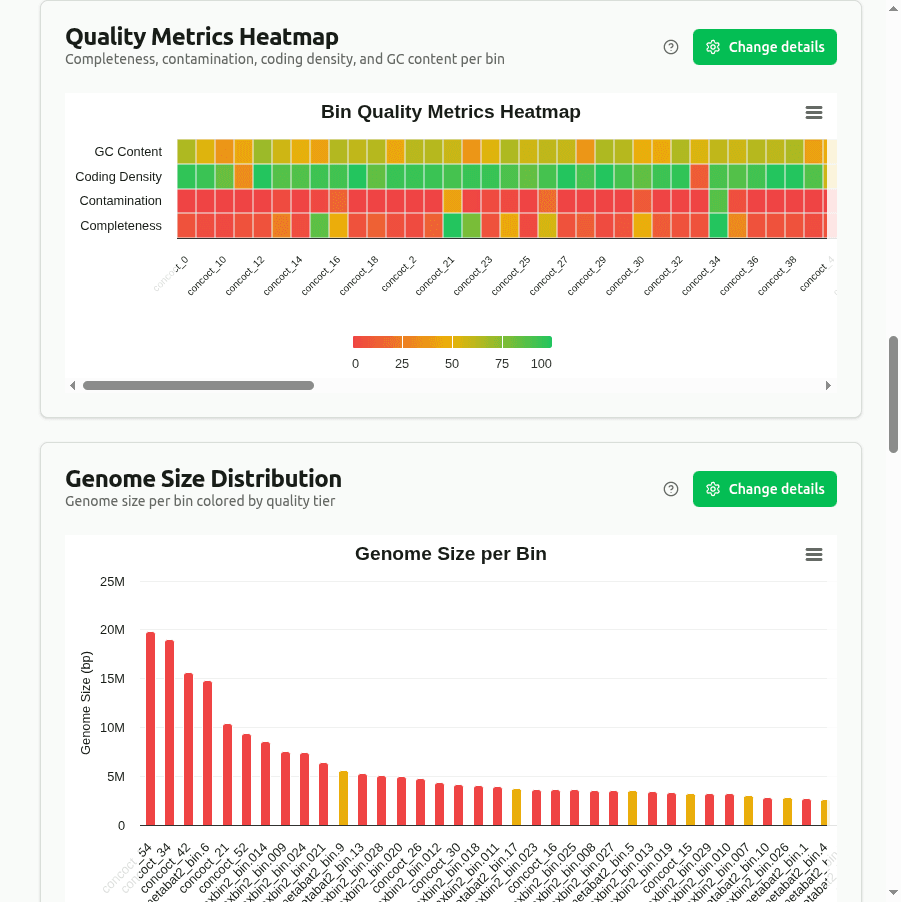
Quality Metrics Heatmap
Completeness, contamination, coding density, and GC content per bin.
CheckM2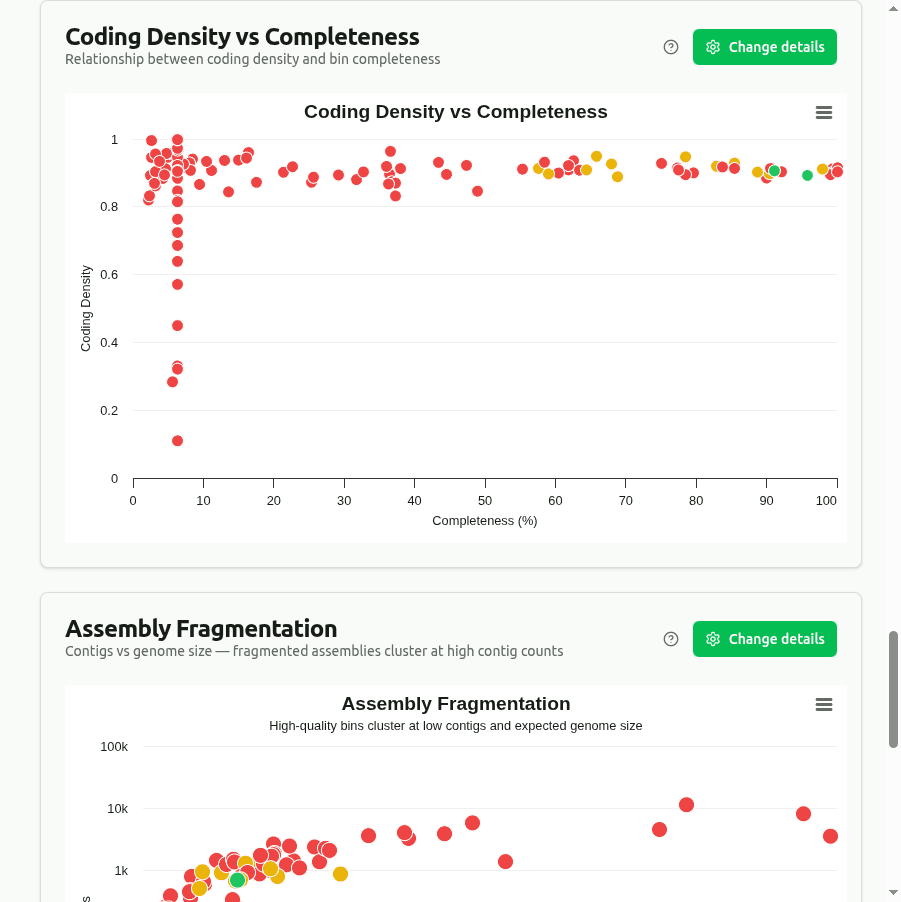
Coding Density vs Completeness
Relationship between coding density and bin completeness.
CheckM2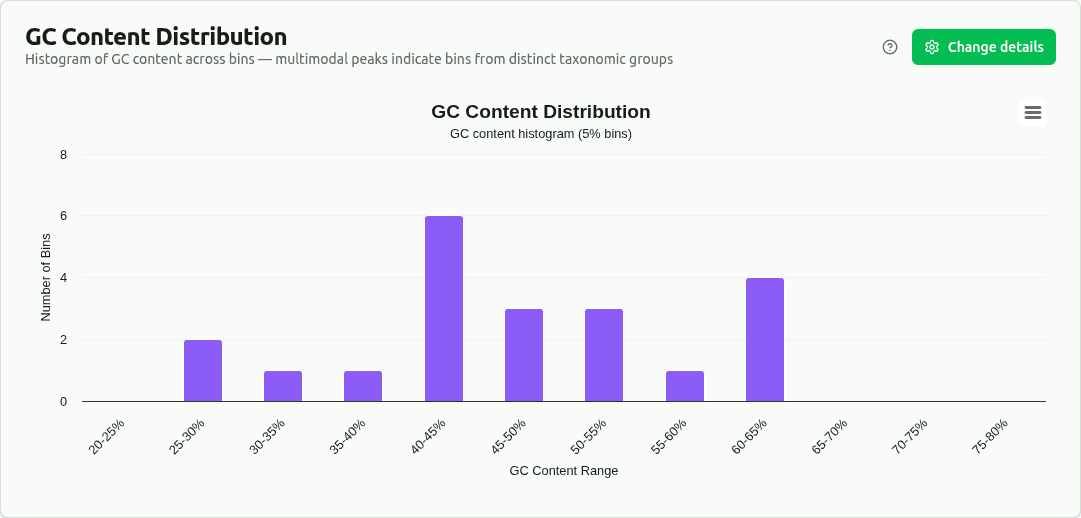
GC Content Histogram
GC distribution in 5% bins — multimodal patterns suggest diverse taxa.
CheckM2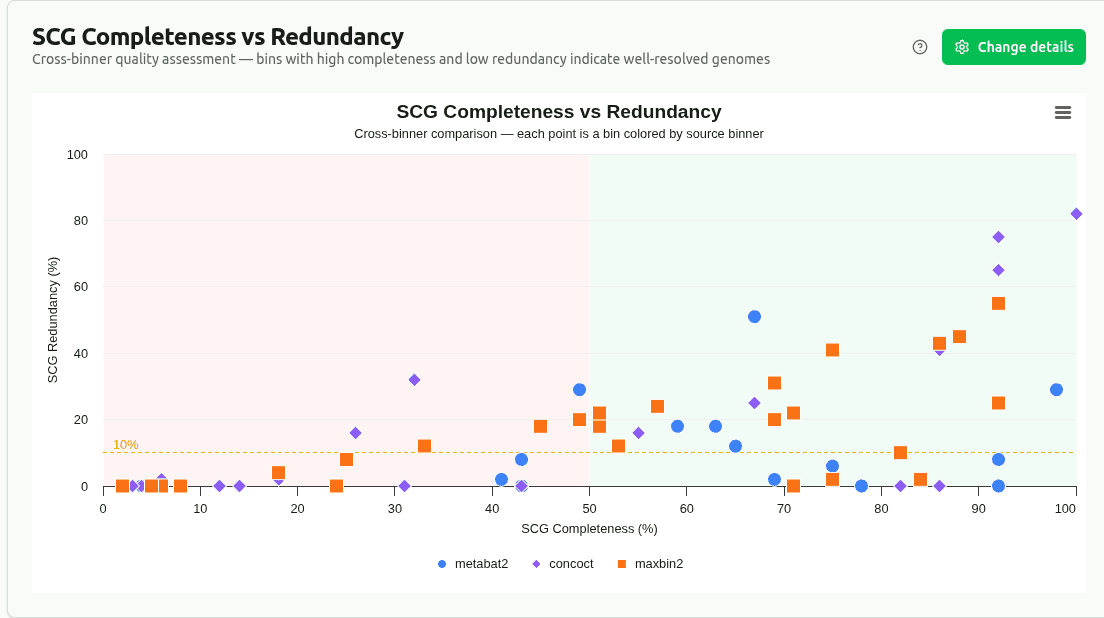
SCG Completeness vs Redundancy
Scatter plot assessment of genome bin quality — high completeness and low redundancy indicate well-resolved genomes.
DAS Tool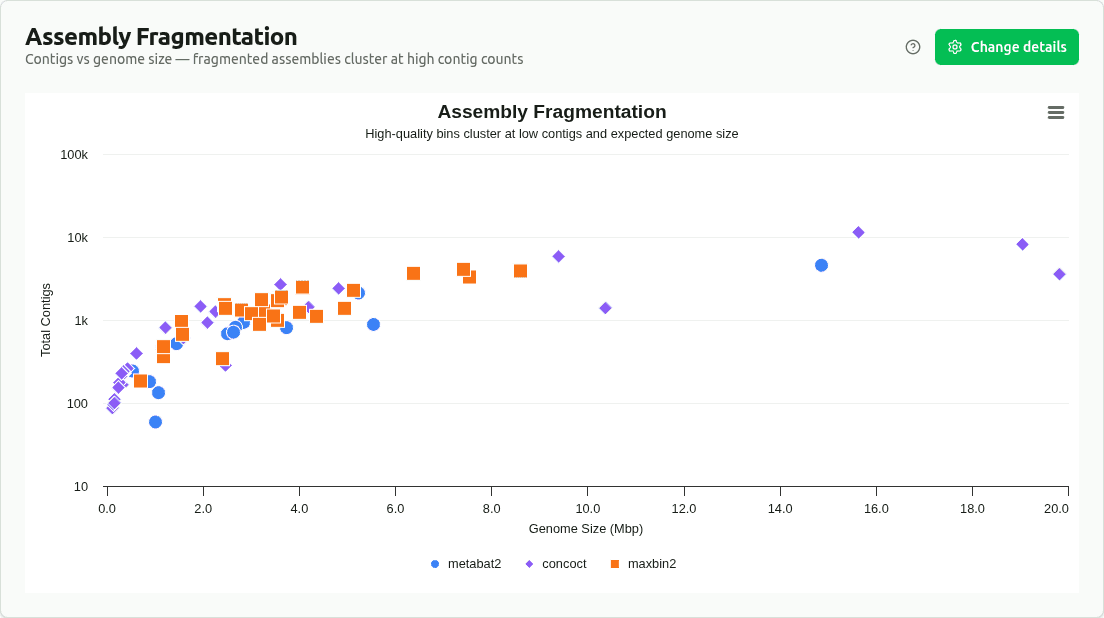
DAS Tool Assembly Fragmentation
Contigs vs genome size colored by binner.
DAS Tool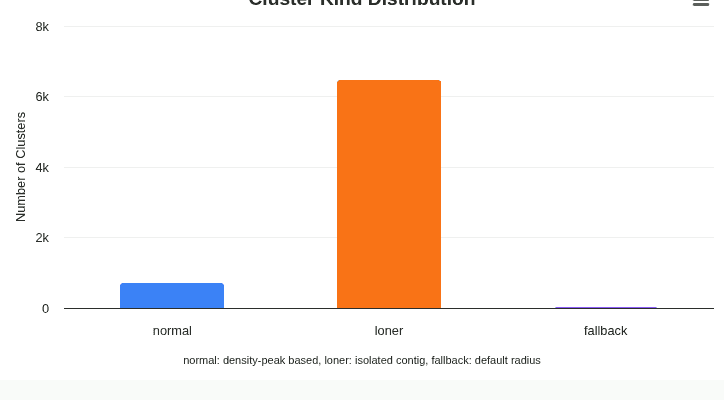
Cluster Kind Distribution
Normal, loner, and fallback cluster distribution.
VAMB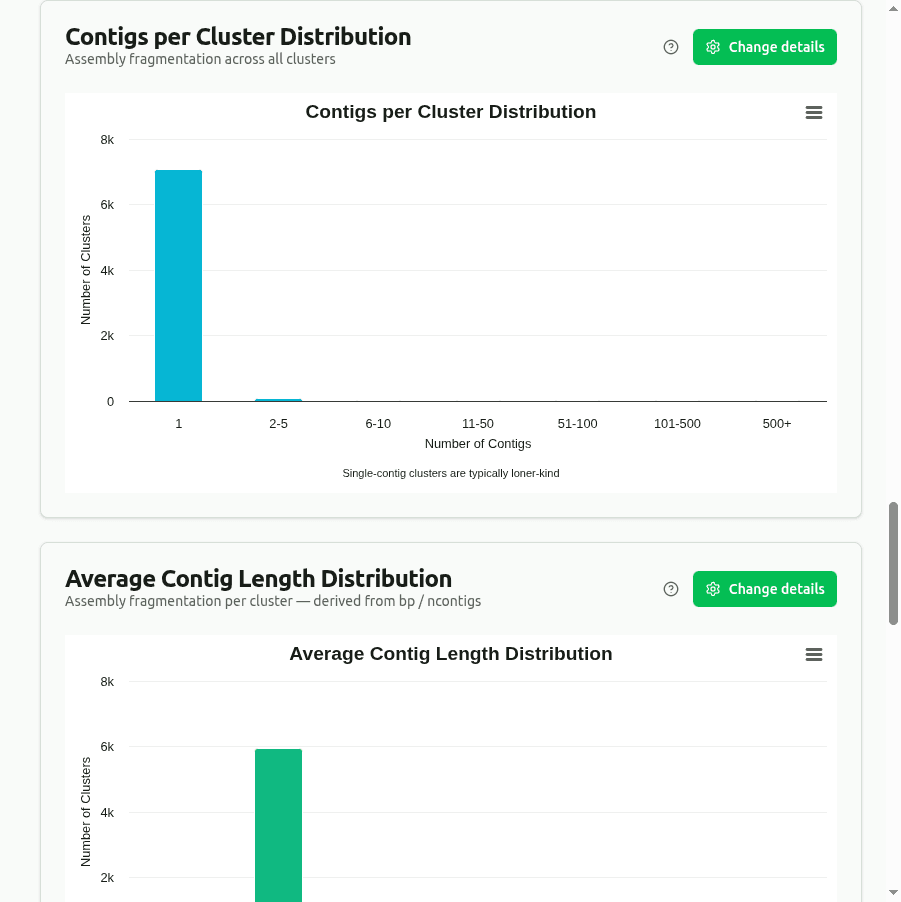
Contigs Distribution
Assembly fragmentation across all clusters.
VAMB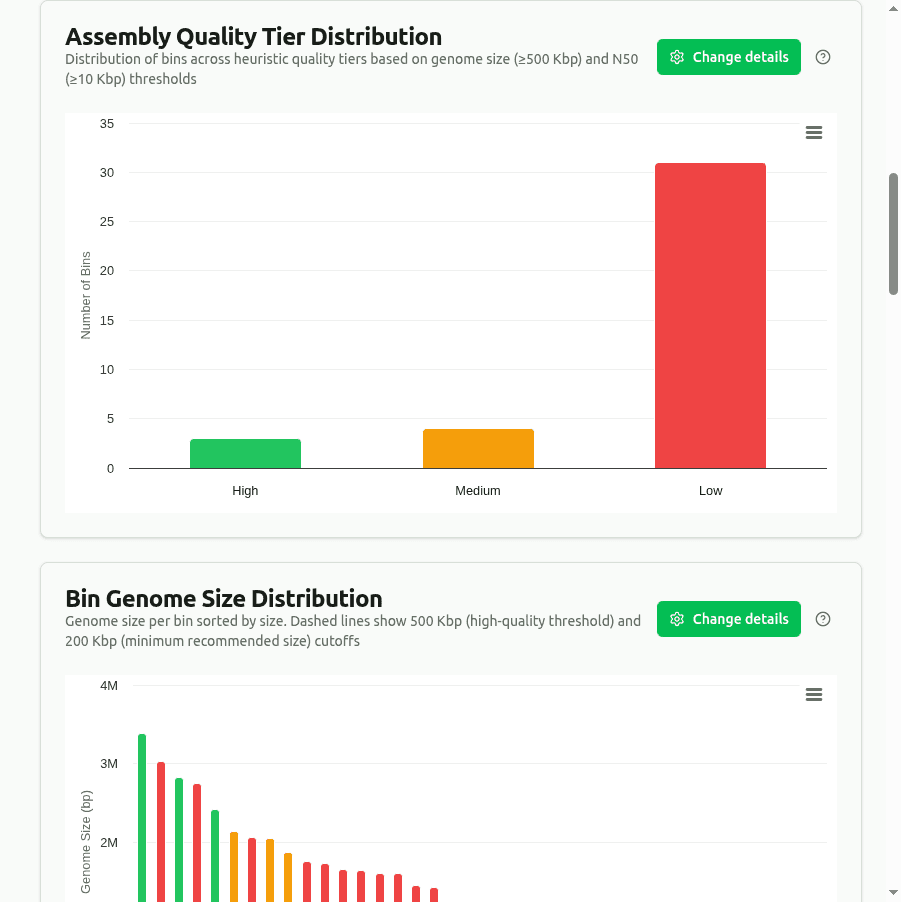
Quality Tier Distribution
Distribution of bins across heuristic quality tiers.
SemiBin2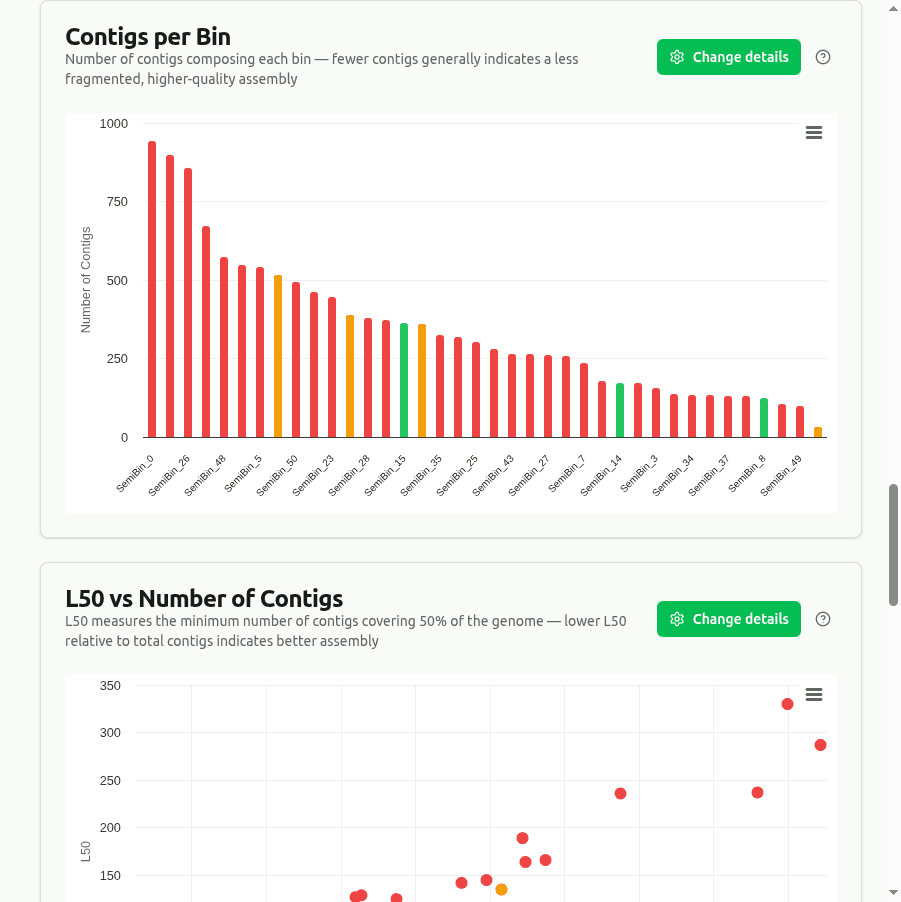
Contigs per Bin
Number of contigs per bin — fewer contigs means better assembly.
SemiBin2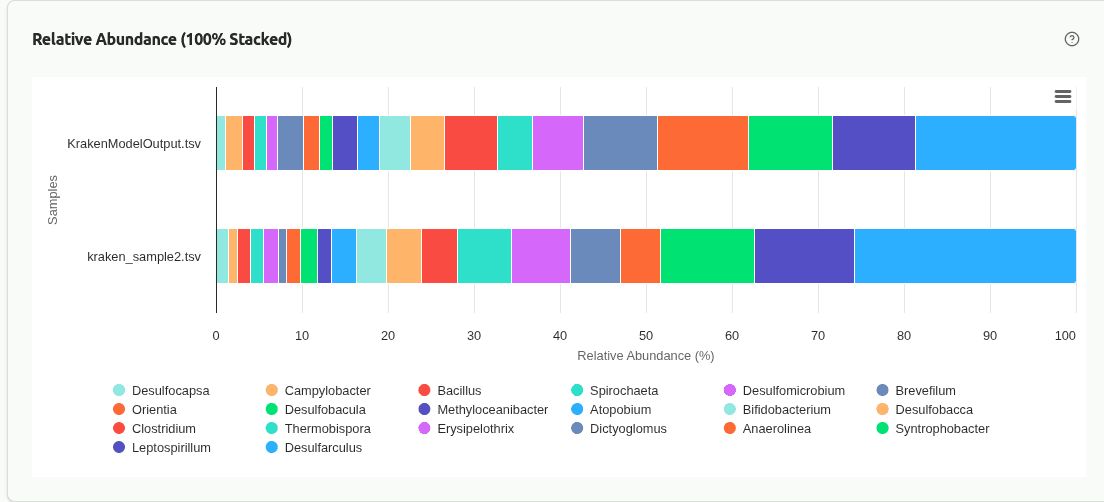
Relative Abundance
100% stacked bars showing proportional taxonomic composition per sample.
Kraken style, CLARK, Kaiju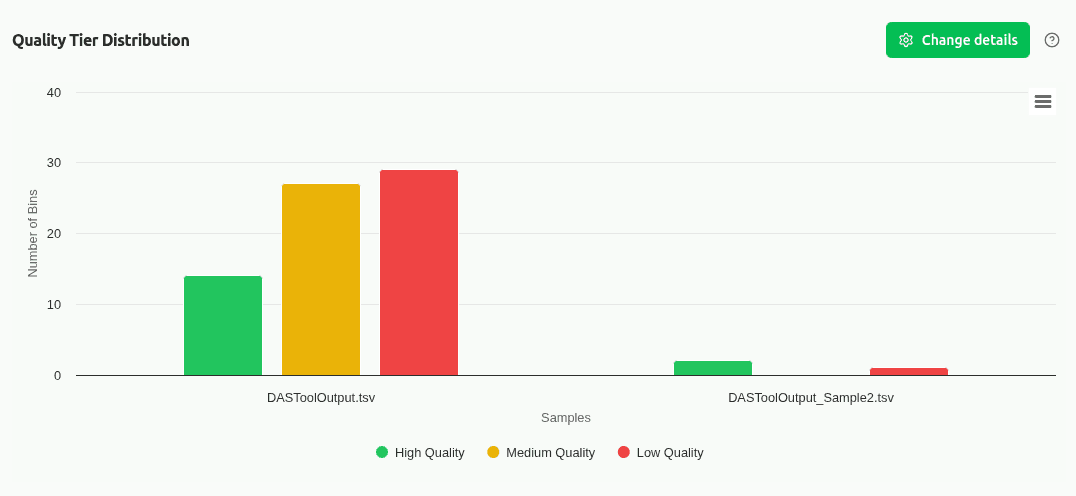
Quality Tier Comparison
Bin quality tier distribution compared across samples.
CheckM2, DAS Tool, VAMB, SemiBin2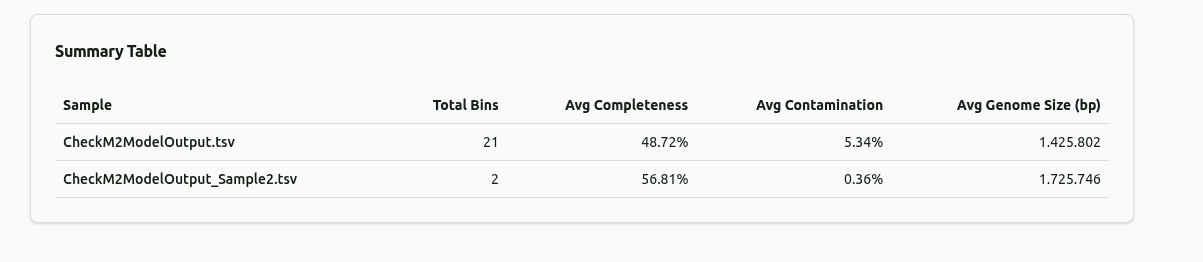
Summary Table
Aggregate metrics per sample: bins, completeness, contamination, genome size.
CheckM2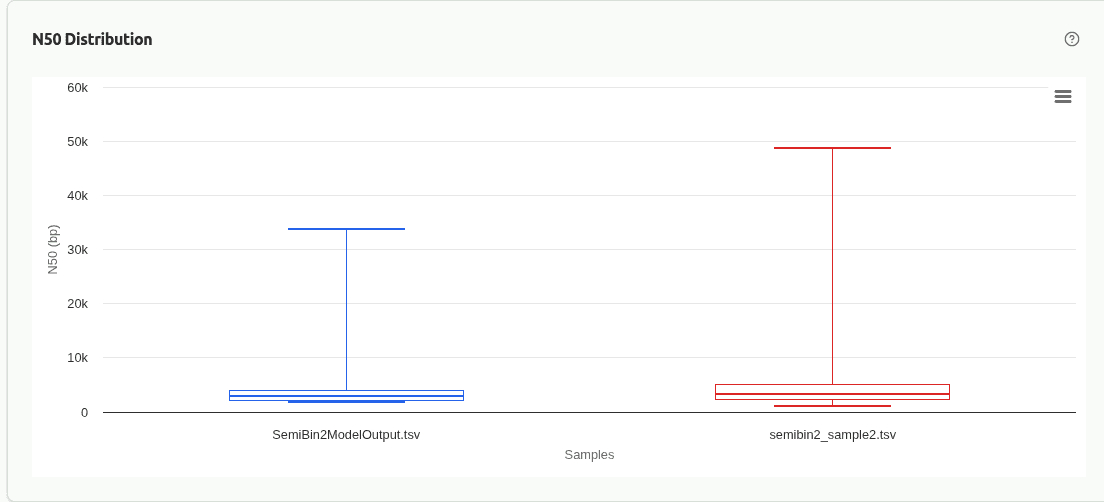
N50 Distribution
Assembly contiguity (N50) compared across samples.
SemiBin2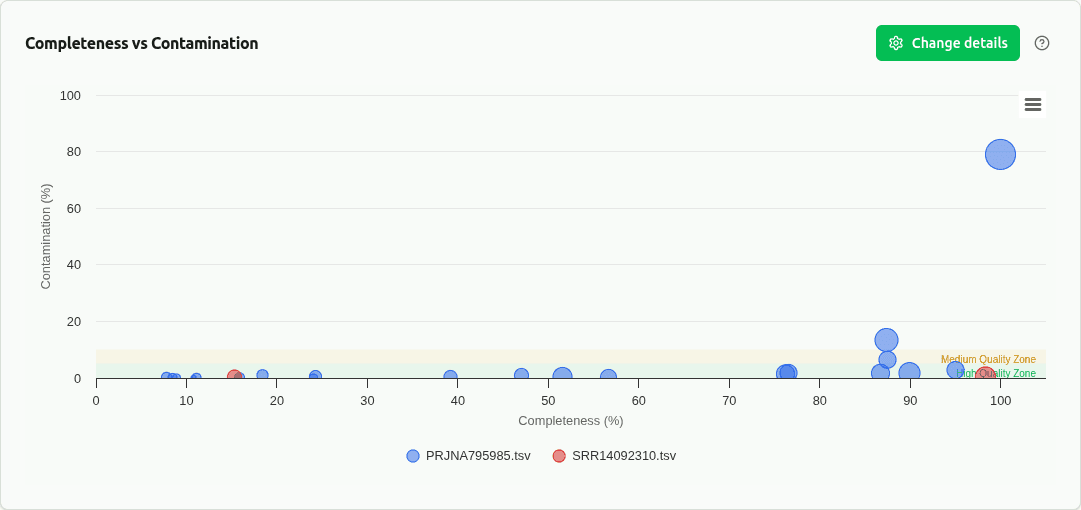
MIMAG Scatter Overlay
Cross-sample scatter of completeness vs contamination colored by sample with MIMAG tier zones.
CheckM2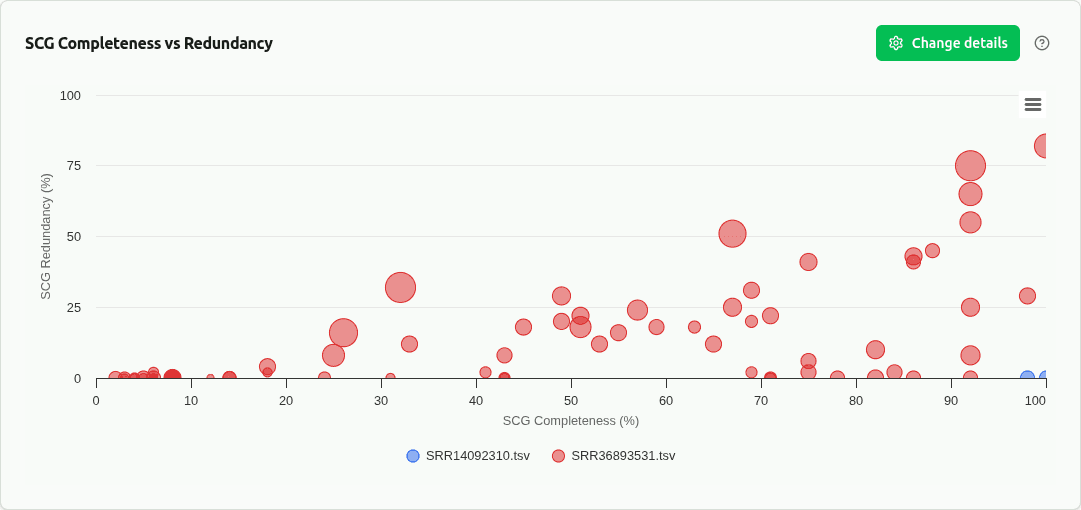
SCG Scatter Comparison
Cross-sample scatter of SCG completeness vs redundancy from DAS Tool consensus scoring.
DAS Tool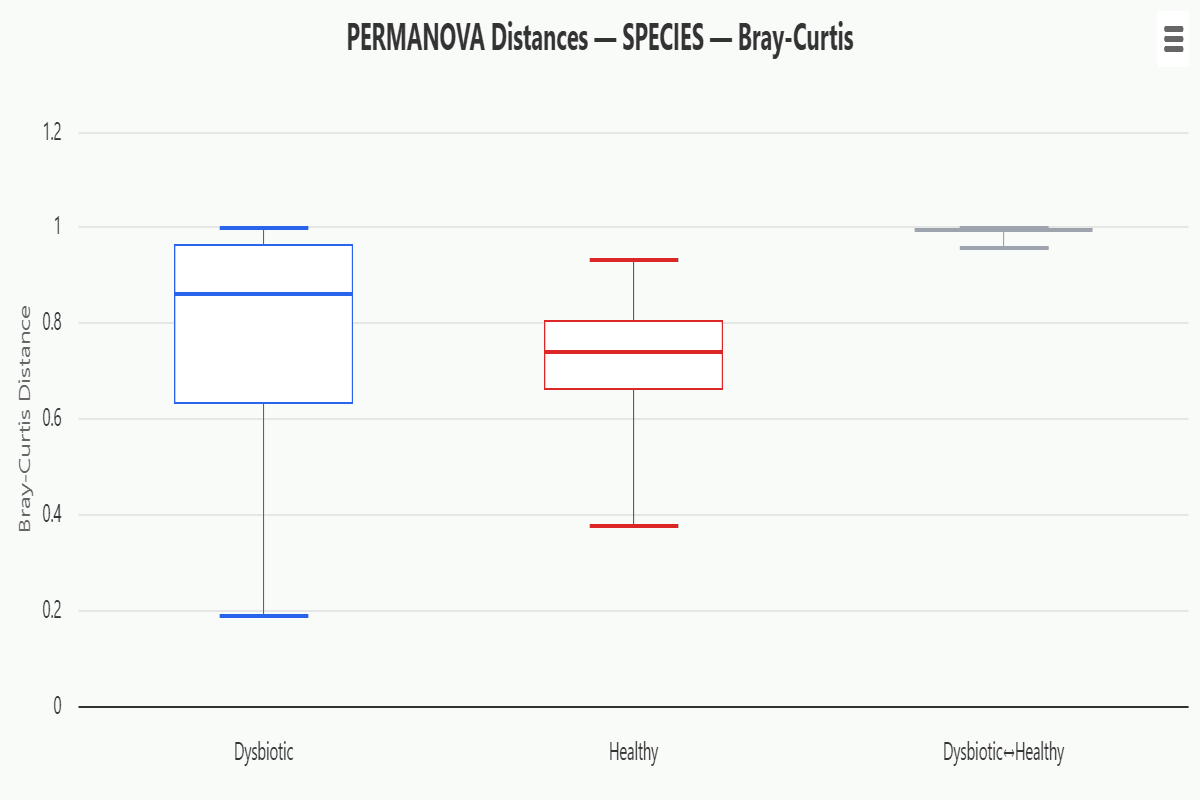
PERMANOVA Distance Boxplots
Within-group vs between-group Bray-Curtis distances with PERMANOVA and ANOSIM statistics.
Kraken style, CLARK, Kaiju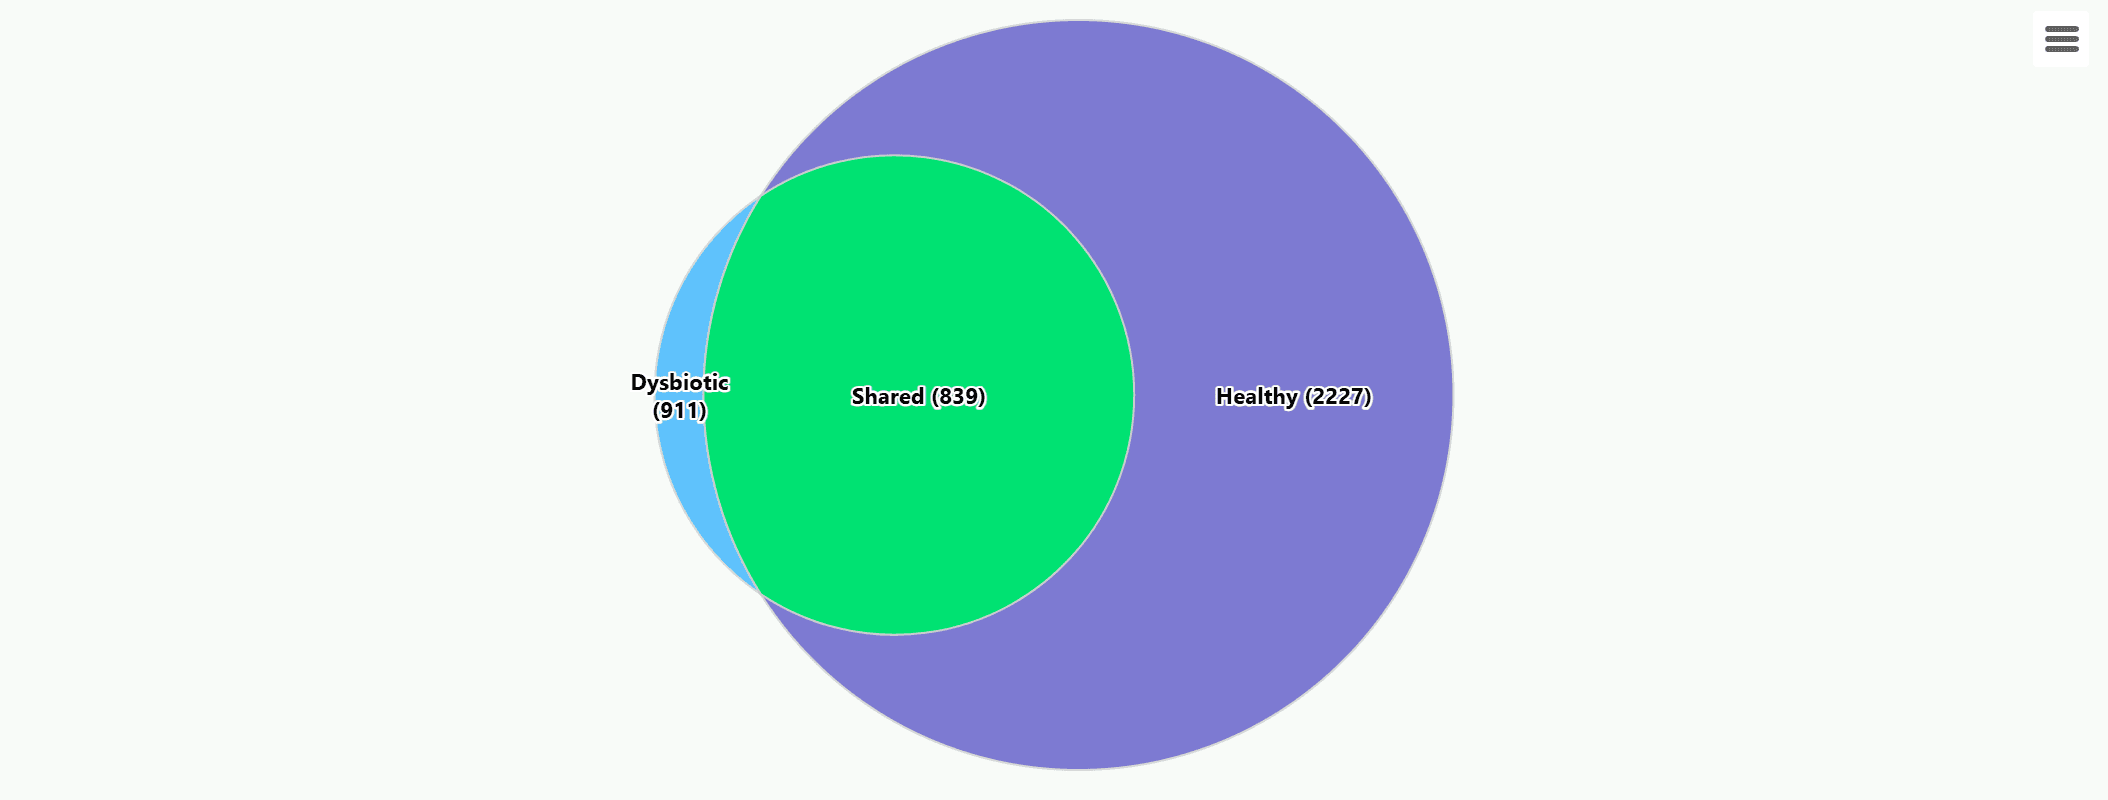
Shared & Unique Taxa (Venn)
Venn diagram showing shared and unique taxa between experimental groups at the selected rank.
Kraken style, CLARK, Kaiju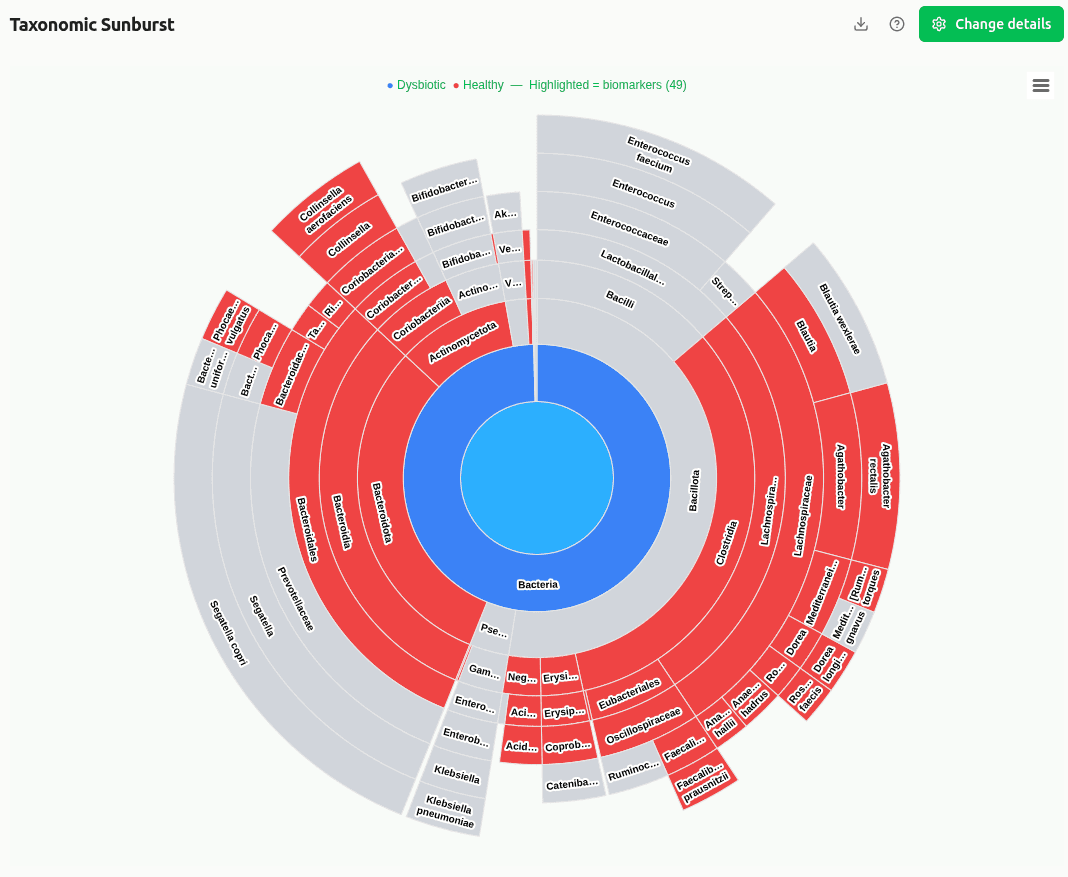
Taxonomic Sunburst
Interactive sunburst of the full taxonomy — LEfSe biomarker nodes colored by enriched group.
Kraken style, CLARK, Kaiju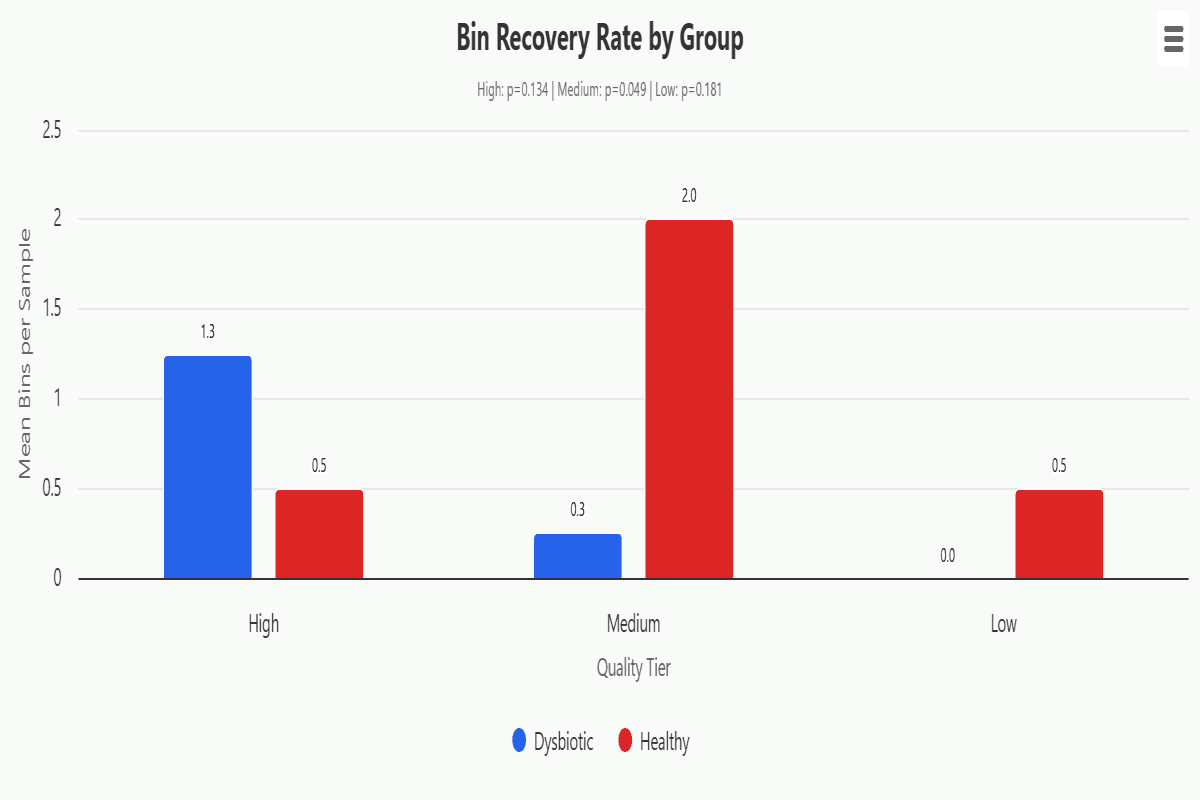
Bin Recovery Rate
Mean bin count per sample at each quality tier across groups with error bars.
CheckM2, DAS Tool, VAMB, SemiBin2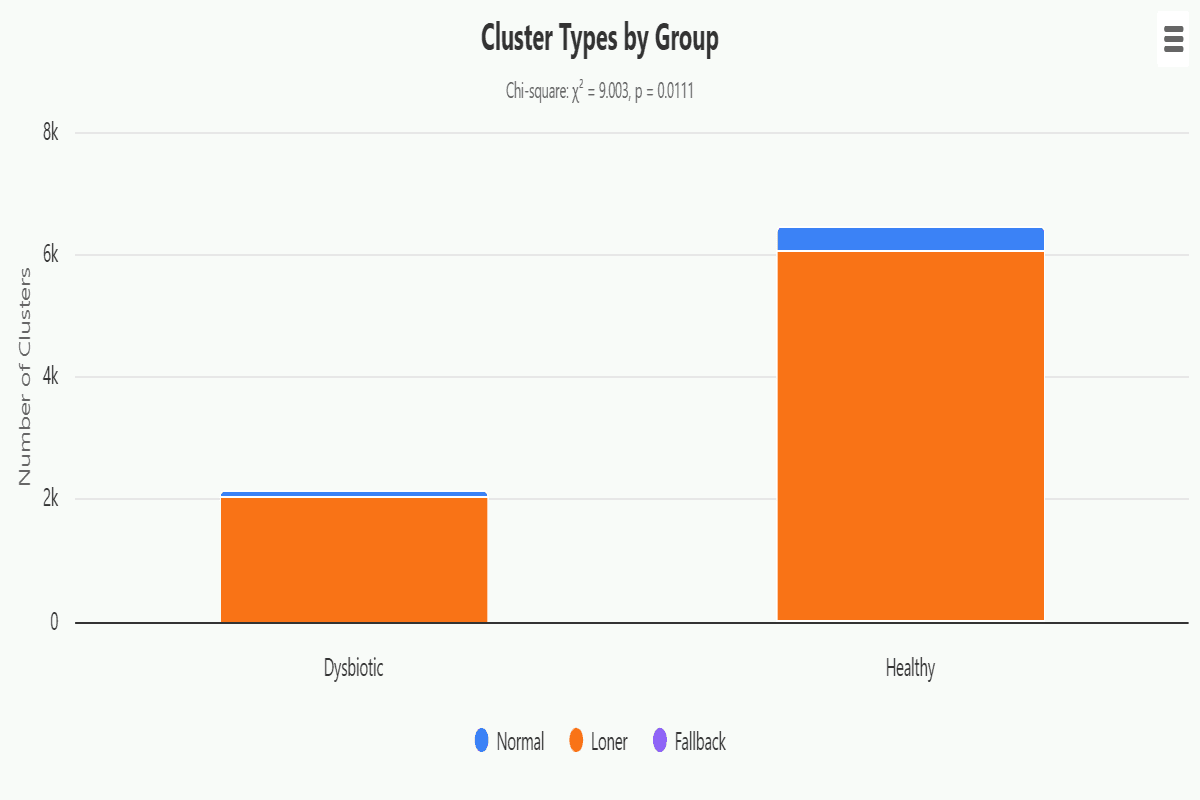
Cluster Types by Group
Stacked bar chart of cluster kind counts (Normal / Loner / Fallback) per group with Chi-square test.
VAMB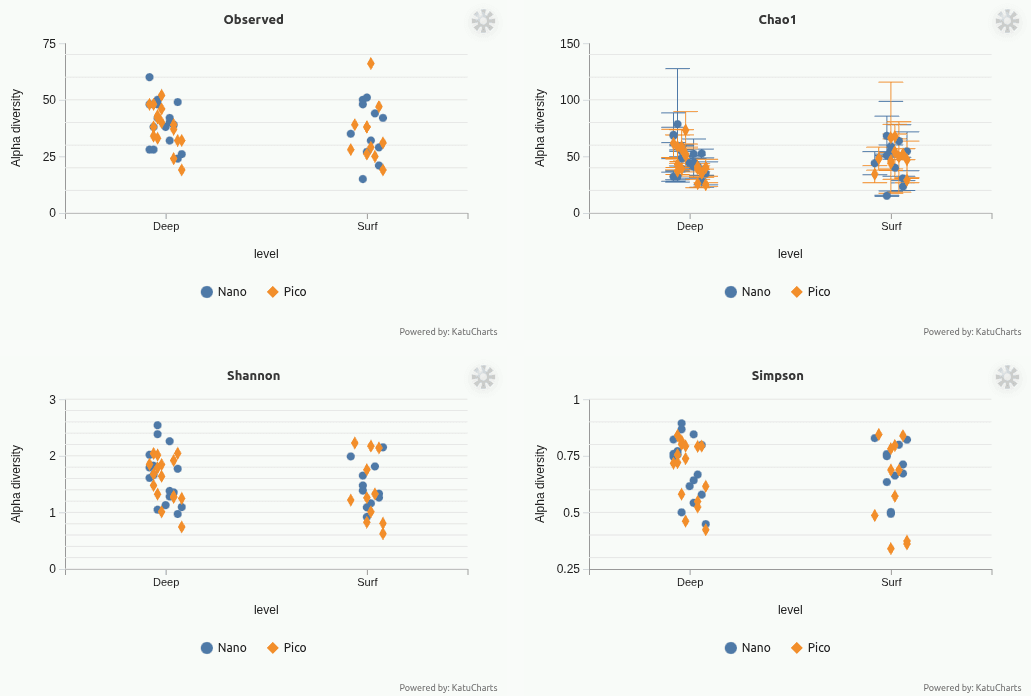
Alpha Diversity
Observed, Chao1, Shannon and Simpson per sample with capped error bars, grouped by any metadata variable.
Microbiome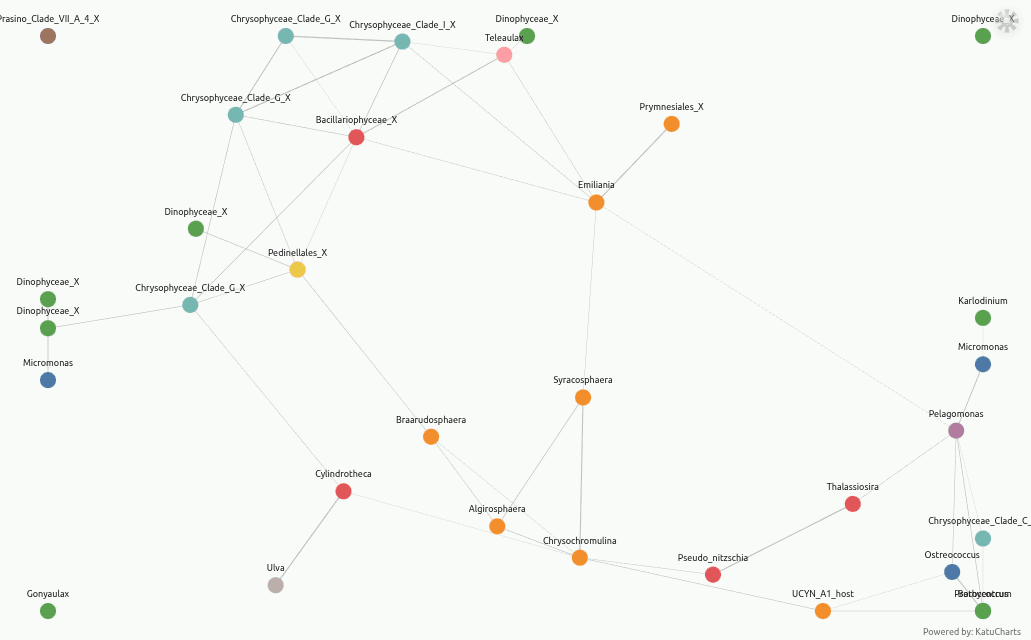
Co-occurrence Network
Abundant taxa linked when their profiles are similar; nodes coloured by rank, draggable, with auto-declustered labels.
MicrobiomeTaxonomic Composition Flow
Follow the hierarchical flow of reads through Sankey diagrams from phylum to family level.
Kraken style, CLARK, KaijuComposition
Pie/donut chart of taxonomic composition by percentage.
Kraken style, CLARK, KaijuRarefaction Curve
Observed taxa vs subsampled read depth — plateau indicates sufficient sequencing depth.
Kraken style, CLARK, KaijuQuality Metrics Heatmap
Completeness, contamination, coding density, and GC content per bin.
CheckM2Coding Density vs Completeness
Relationship between coding density and bin completeness.
CheckM2GC Content Histogram
GC distribution in 5% bins — multimodal patterns suggest diverse taxa.
CheckM2SCG Completeness vs Redundancy
Scatter plot assessment of genome bin quality — high completeness and low redundancy indicate well-resolved genomes.
DAS ToolDAS Tool Assembly Fragmentation
Contigs vs genome size colored by binner.
DAS ToolCluster Kind Distribution
Normal, loner, and fallback cluster distribution.
VAMBContigs Distribution
Assembly fragmentation across all clusters.
VAMBQuality Tier Distribution
Distribution of bins across heuristic quality tiers.
SemiBin2Contigs per Bin
Number of contigs per bin — fewer contigs means better assembly.
SemiBin2Relative Abundance
100% stacked bars showing proportional taxonomic composition per sample.
Kraken style, CLARK, KaijuQuality Tier Comparison
Bin quality tier distribution compared across samples.
CheckM2, DAS Tool, VAMB, SemiBin2Summary Table
Aggregate metrics per sample: bins, completeness, contamination, genome size.
CheckM2N50 Distribution
Assembly contiguity (N50) compared across samples.
SemiBin2MIMAG Scatter Overlay
Cross-sample scatter of completeness vs contamination colored by sample with MIMAG tier zones.
CheckM2SCG Scatter Comparison
Cross-sample scatter of SCG completeness vs redundancy from DAS Tool consensus scoring.
DAS ToolPERMANOVA Distance Boxplots
Within-group vs between-group Bray-Curtis distances with PERMANOVA and ANOSIM statistics.
Kraken style, CLARK, KaijuShared & Unique Taxa (Venn)
Venn diagram showing shared and unique taxa between experimental groups at the selected rank.
Kraken style, CLARK, KaijuTaxonomic Sunburst
Interactive sunburst of the full taxonomy — LEfSe biomarker nodes colored by enriched group.
Kraken style, CLARK, KaijuBin Recovery Rate
Mean bin count per sample at each quality tier across groups with error bars.
CheckM2, DAS Tool, VAMB, SemiBin2Cluster Types by Group
Stacked bar chart of cluster kind counts (Normal / Loner / Fallback) per group with Chi-square test.
VAMBAlpha Diversity
Observed, Chao1, Shannon and Simpson per sample with capped error bars, grouped by any metadata variable.
MicrobiomeCo-occurrence Network
Abundant taxa linked when their profiles are similar; nodes coloured by rank, draggable, with auto-declustered labels.
Microbiome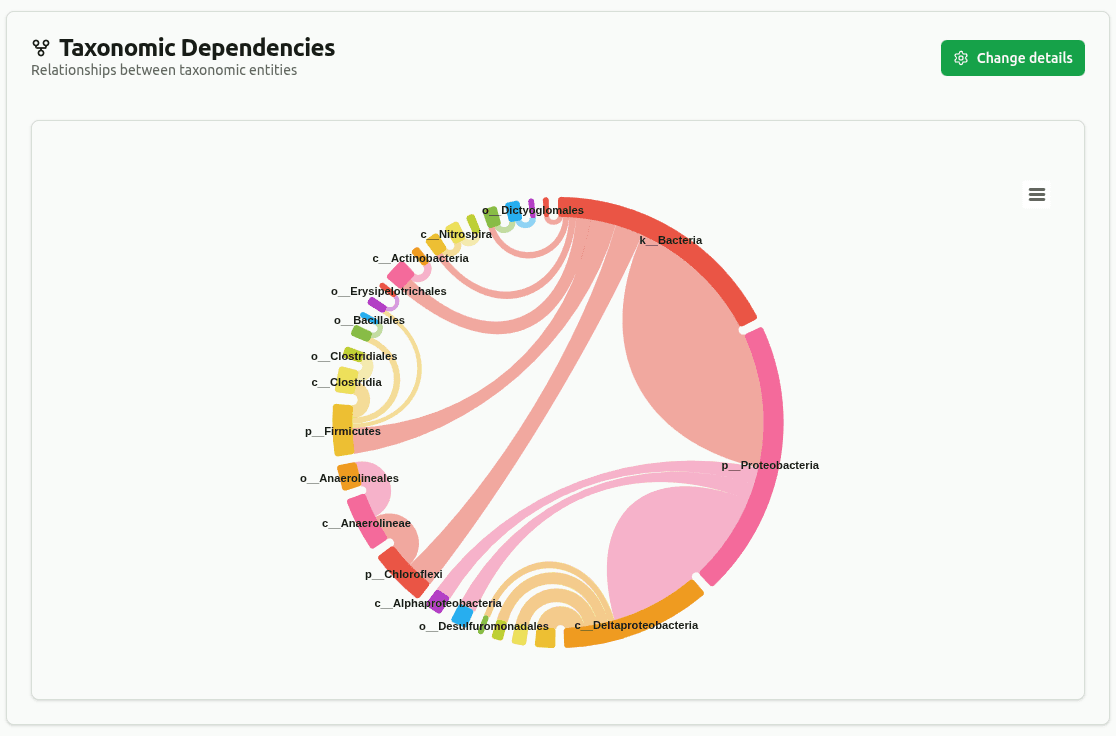
Taxonomic Dependencies
Chord diagram showing lineage relationships between taxa across all classification levels.
Kraken style, CLARK, Kaiju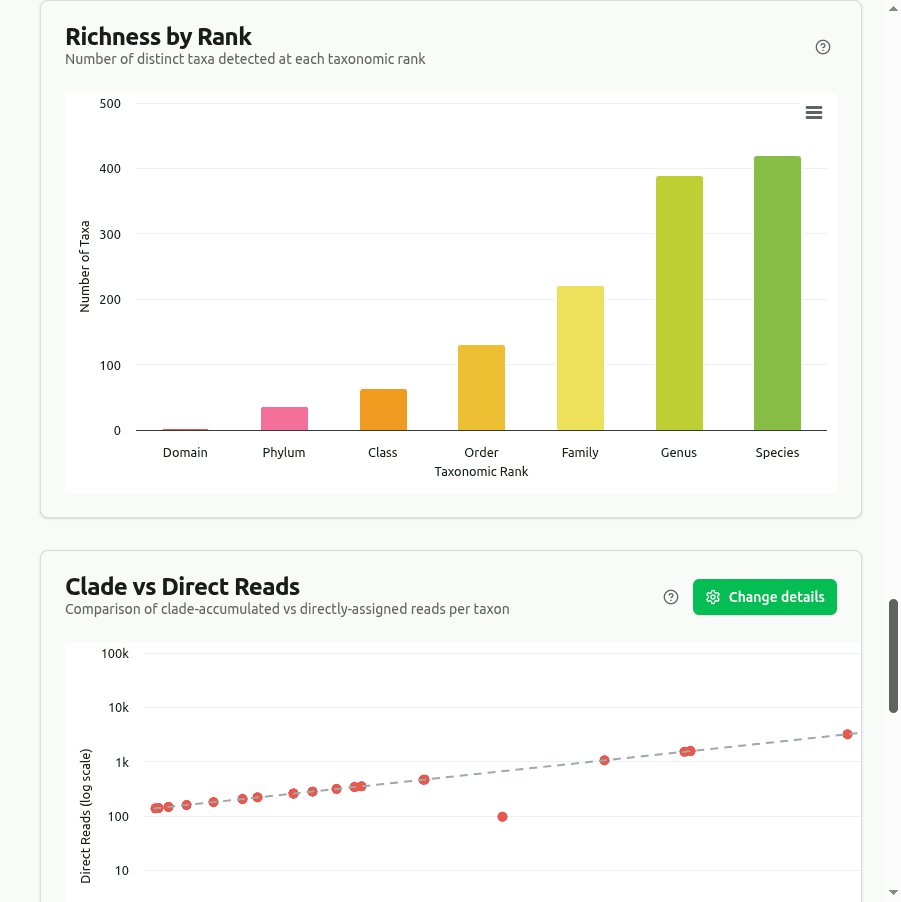
Richness by Rank
Number of distinct taxa detected at each taxonomic rank.
Kraken style, CLARK, Kaiju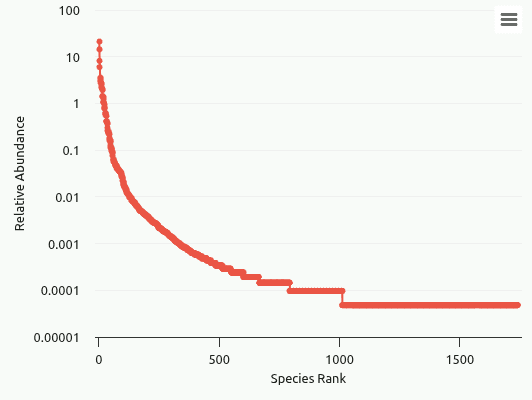
Rank Abundance (Whittaker)
Taxa ranked by decreasing abundance on log scale — slope indicates evenness.
Kraken style, CLARK, Kaiju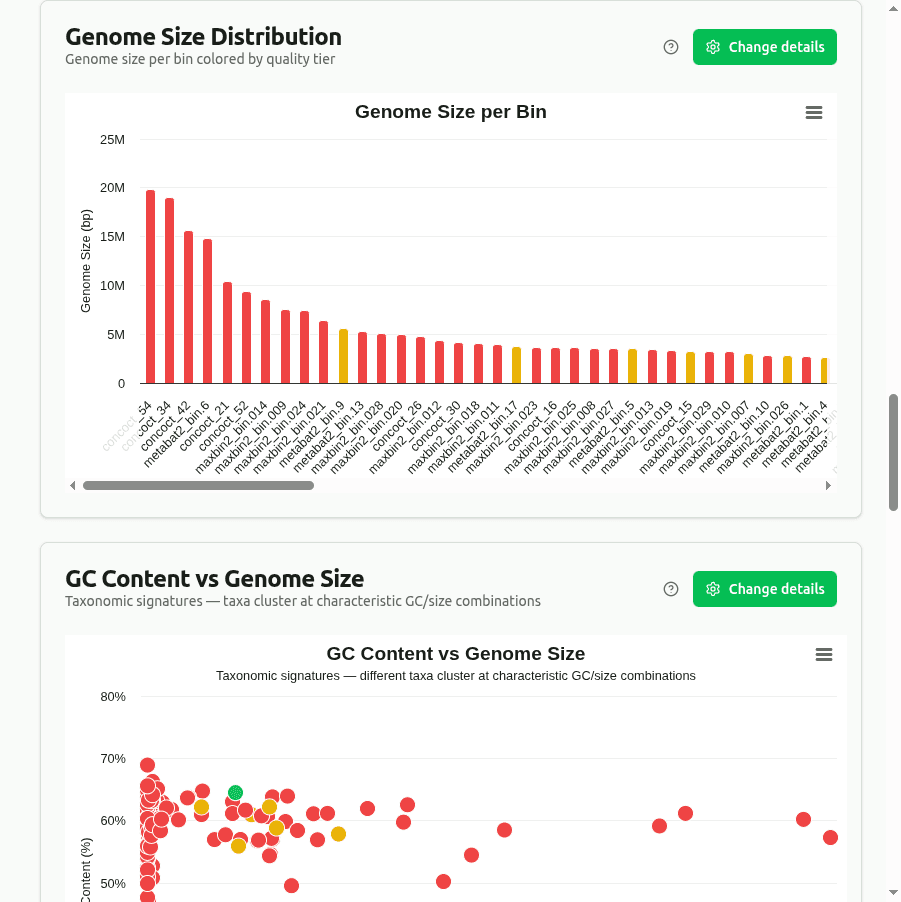
Genome Size Distribution
Genome size per bin colored by quality tier.
CheckM2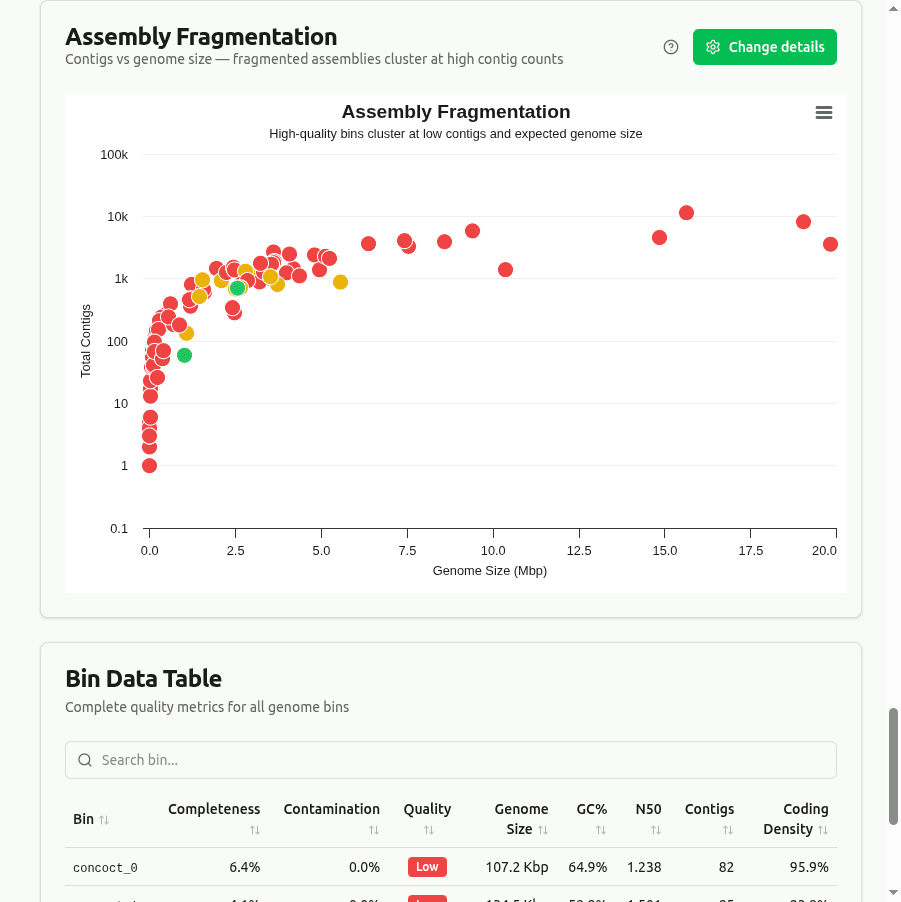
Assembly Fragmentation
Contigs vs genome size — fragmented assemblies cluster at high contig counts.
CheckM2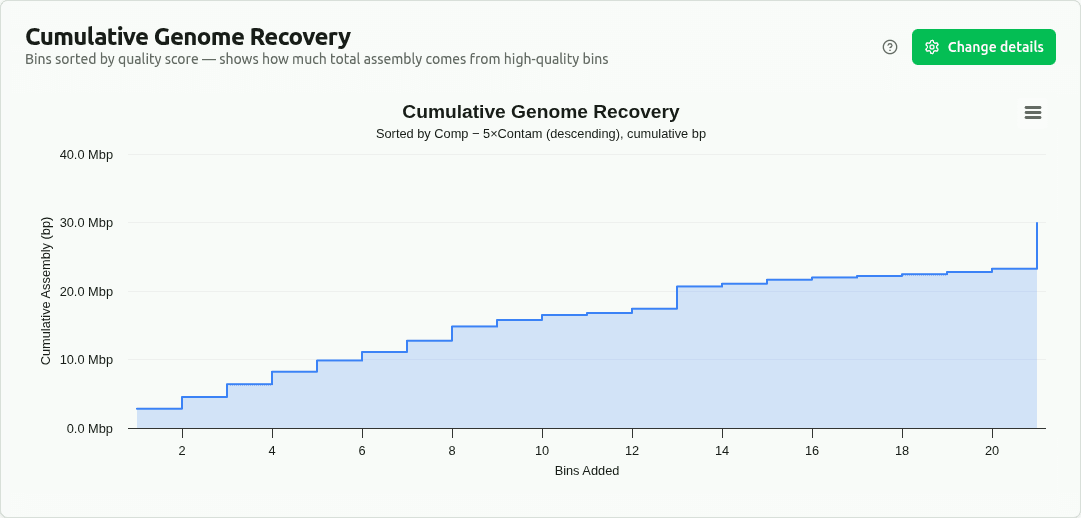
Cumulative Genome Recovery
Running total of genome size sorted by quality score — steep rise = high-quality bins dominate.
CheckM2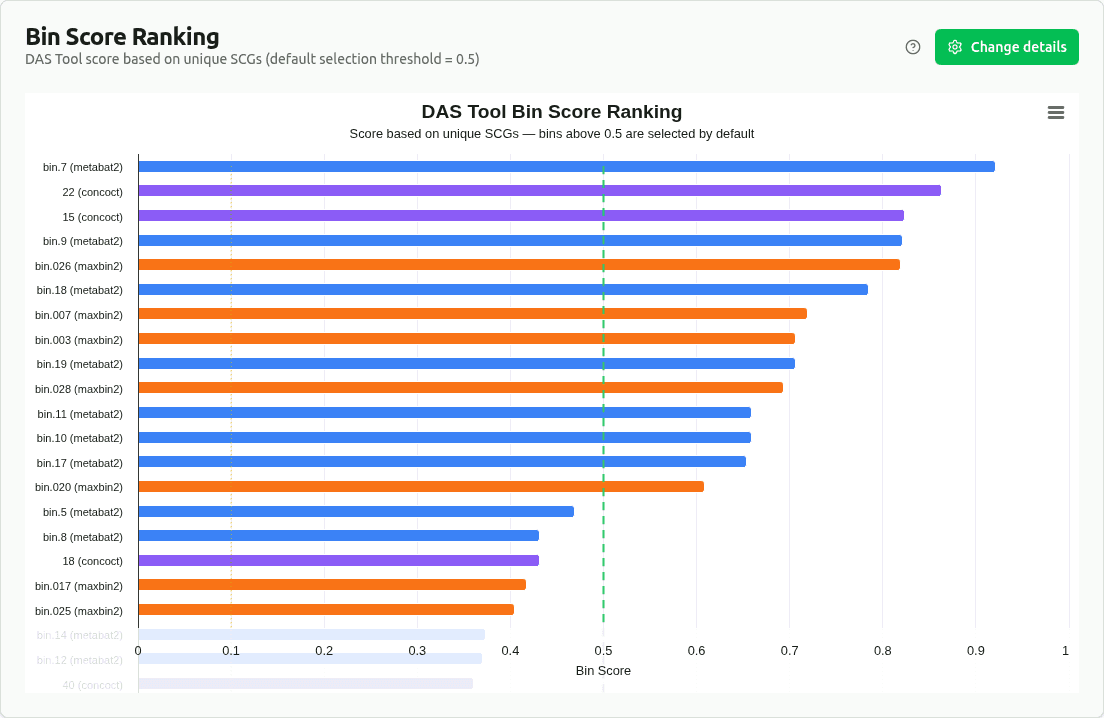
Bin Score Ranking
DAS Tool score based on unique SCGs — bins above 0.5 selected by default.
DAS Tool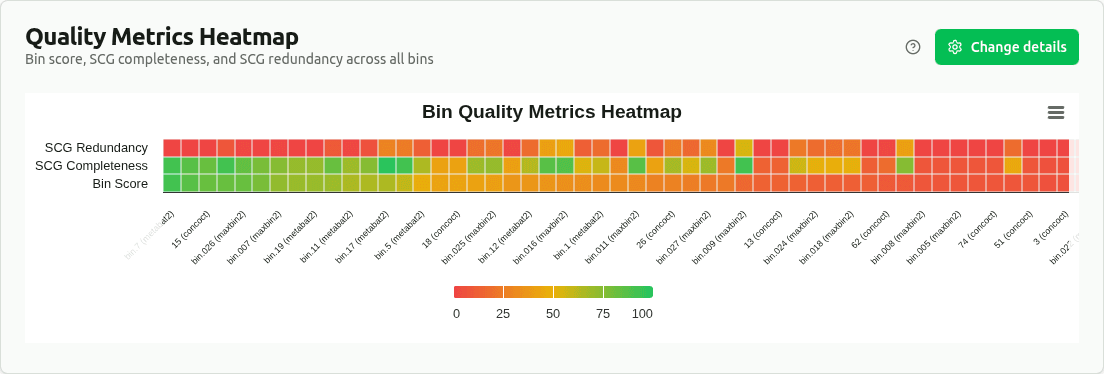
DAS Tool Heatmap
Bin score, SCG completeness, and redundancy across all bins.
DAS Tool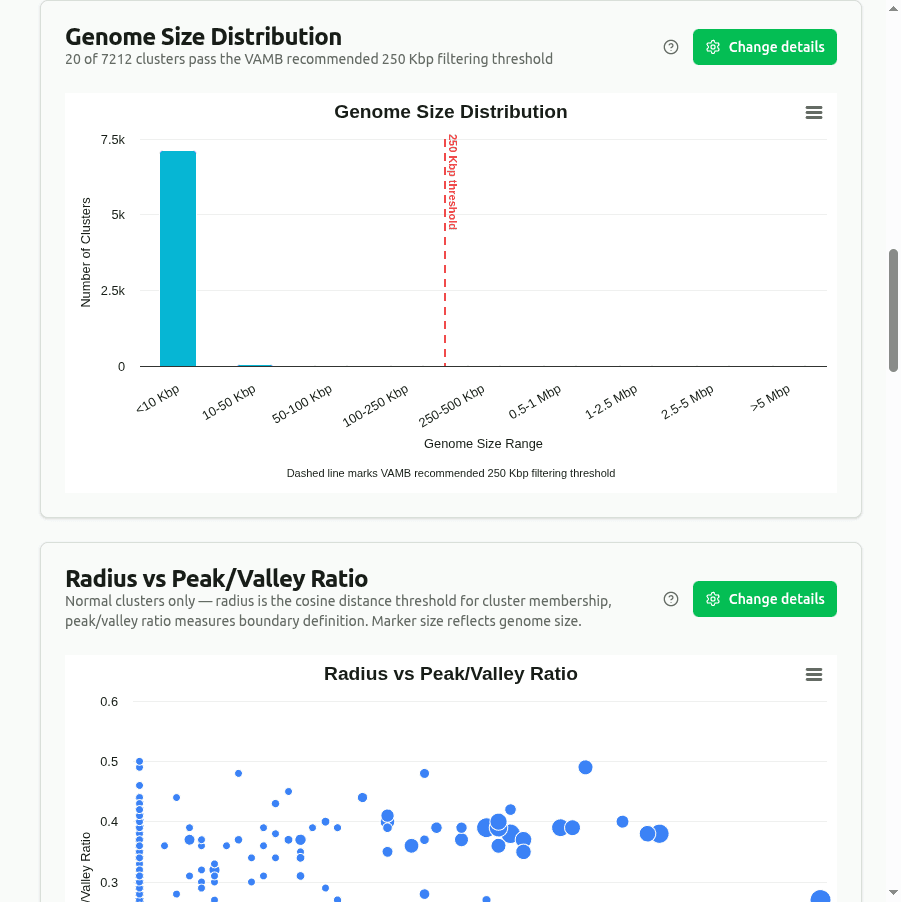
VAMB Genome Size
Genome size distribution with 250 Kbp filtering threshold.
VAMB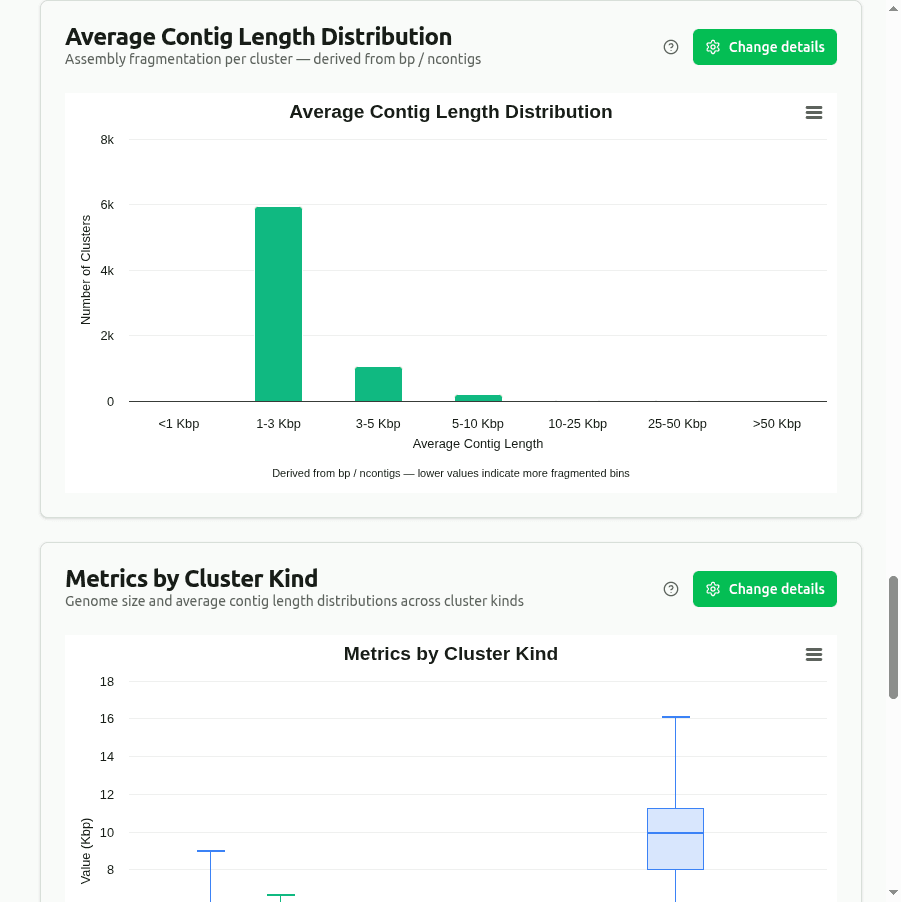
Average Contig Length
Fragmentation per cluster — derived from bp / ncontigs.
VAMB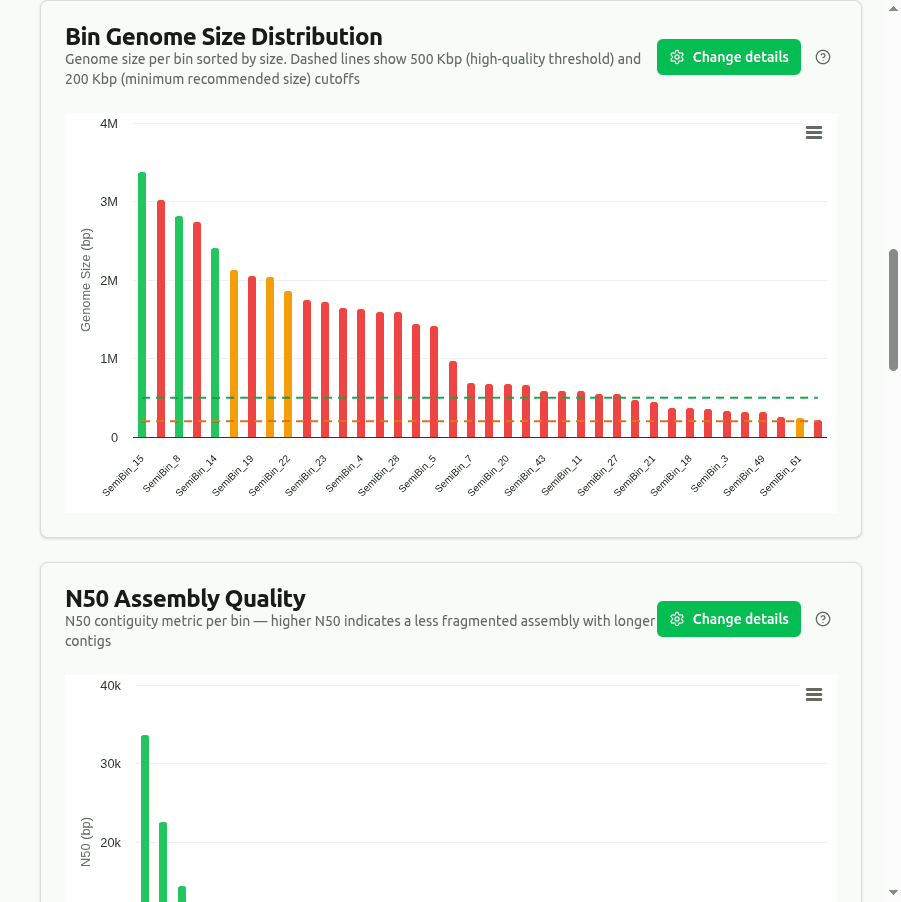
SemiBin2 Genome Size
Genome size per bin with quality threshold cutoffs.
SemiBin2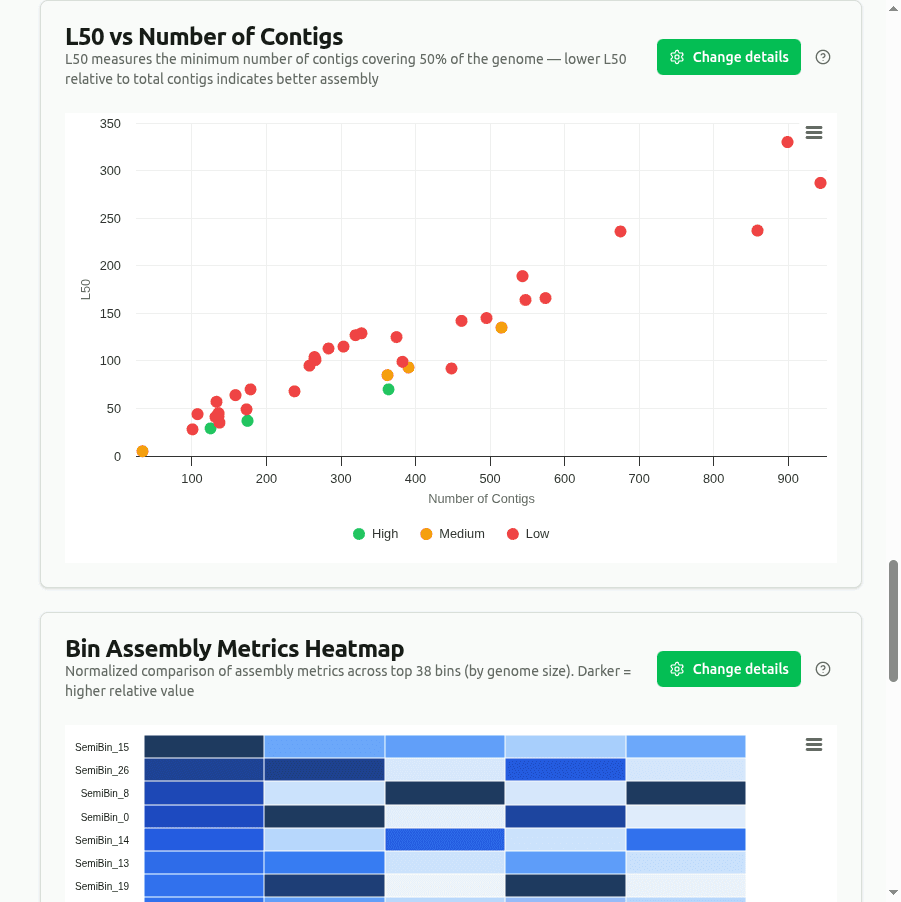
L50 vs Number of Contigs
Lower L50 relative to total contigs indicates better assembly.
SemiBin2Abundance Heatmap
Cross-sample heatmap of taxonomic abundance at selected rank.
Kraken style, CLARK, Kaiju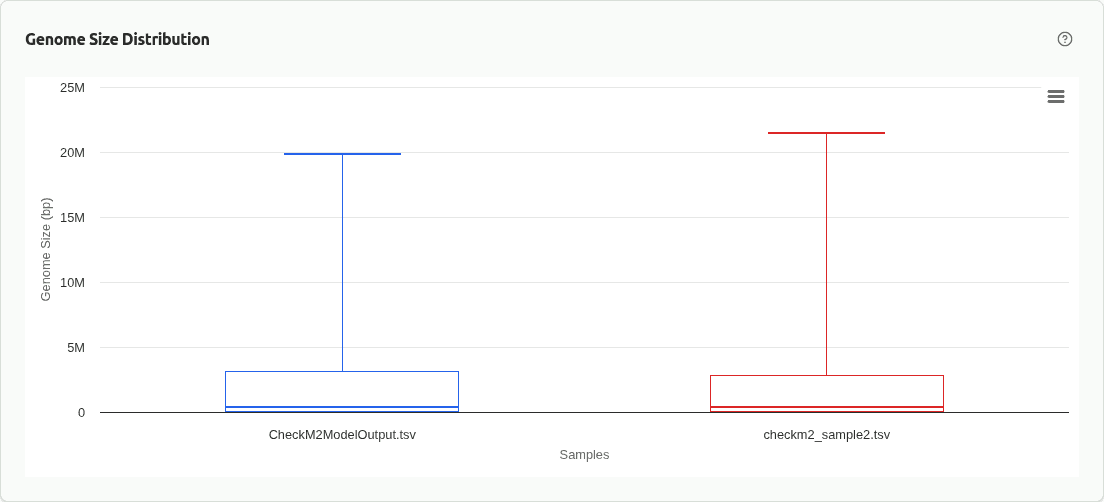
Genome Size Comparison
Genome size distribution across samples.
CheckM2, DAS Tool, VAMB, SemiBin2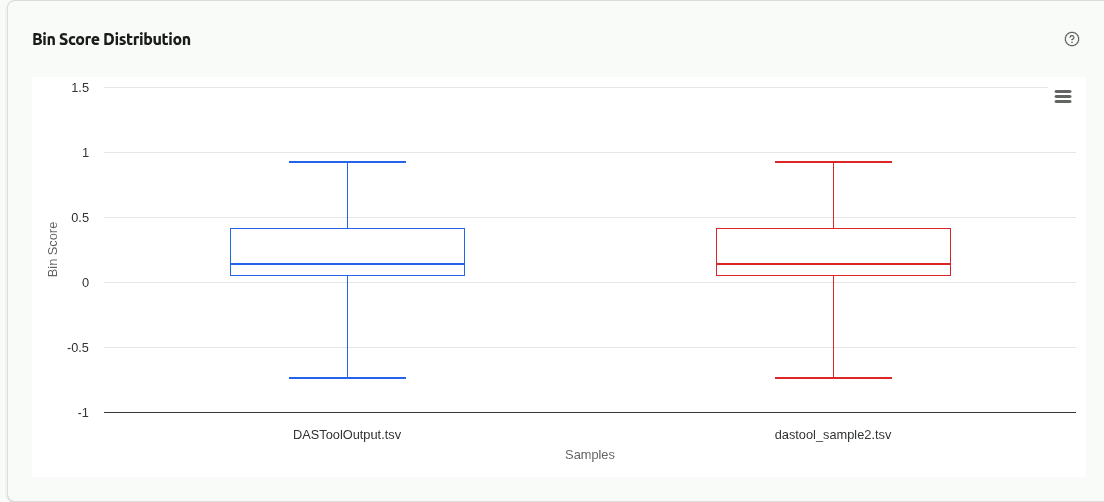
Bin Score Distribution
DAS Tool bin score distribution compared across samples.
DAS Tool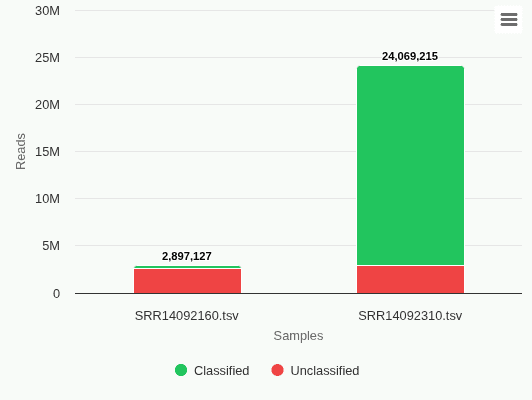
Classified vs Unclassified
Stacked bars showing classified vs unclassified reads per sample.
Kraken style, CLARK, Kaiju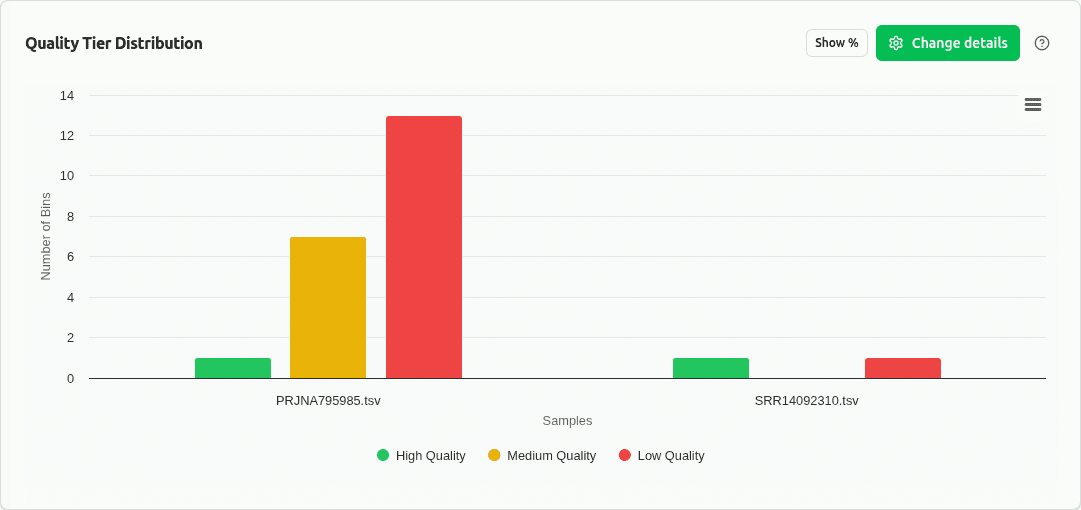
Quality % Comparison
100% stacked bars of High/Medium/Low quality proportions per sample.
CheckM2, DAS Tool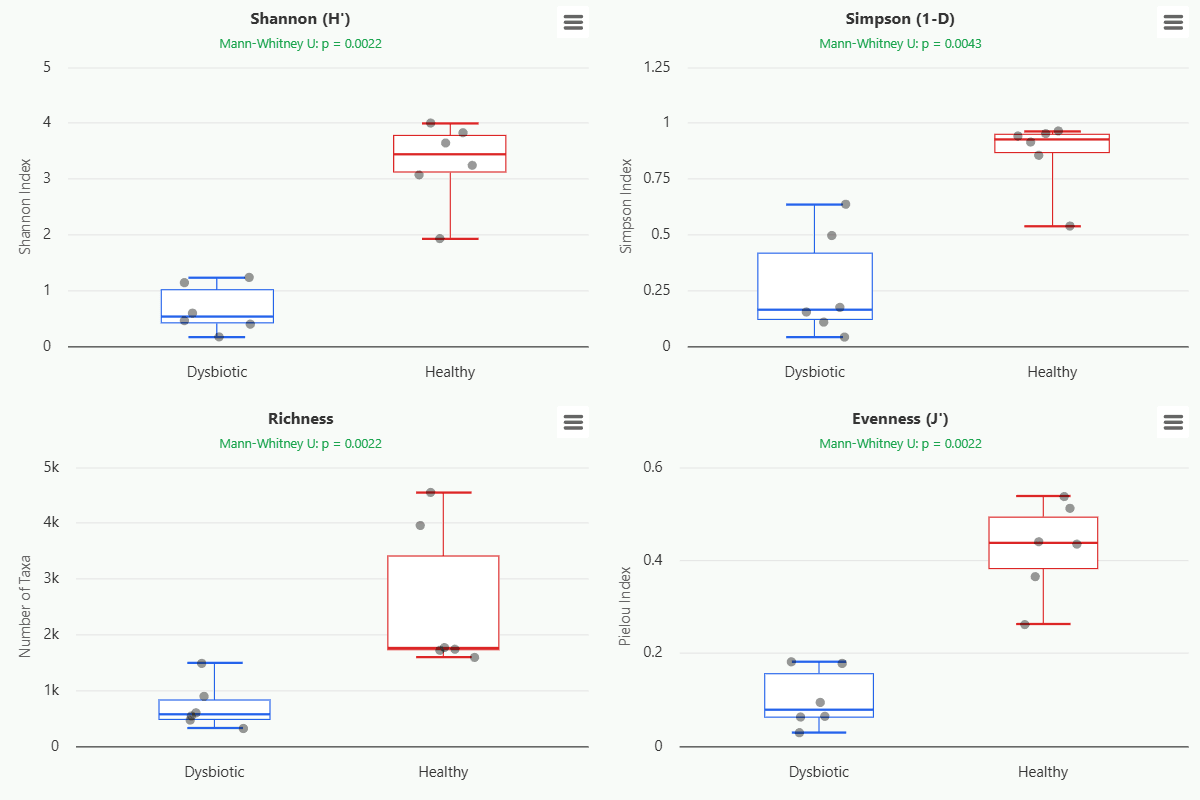
Alpha Diversity Boxplots
Shannon, Simpson, Richness, and Evenness distributions per group as boxplots with statistical tests.
Kraken style, CLARK, Kaiju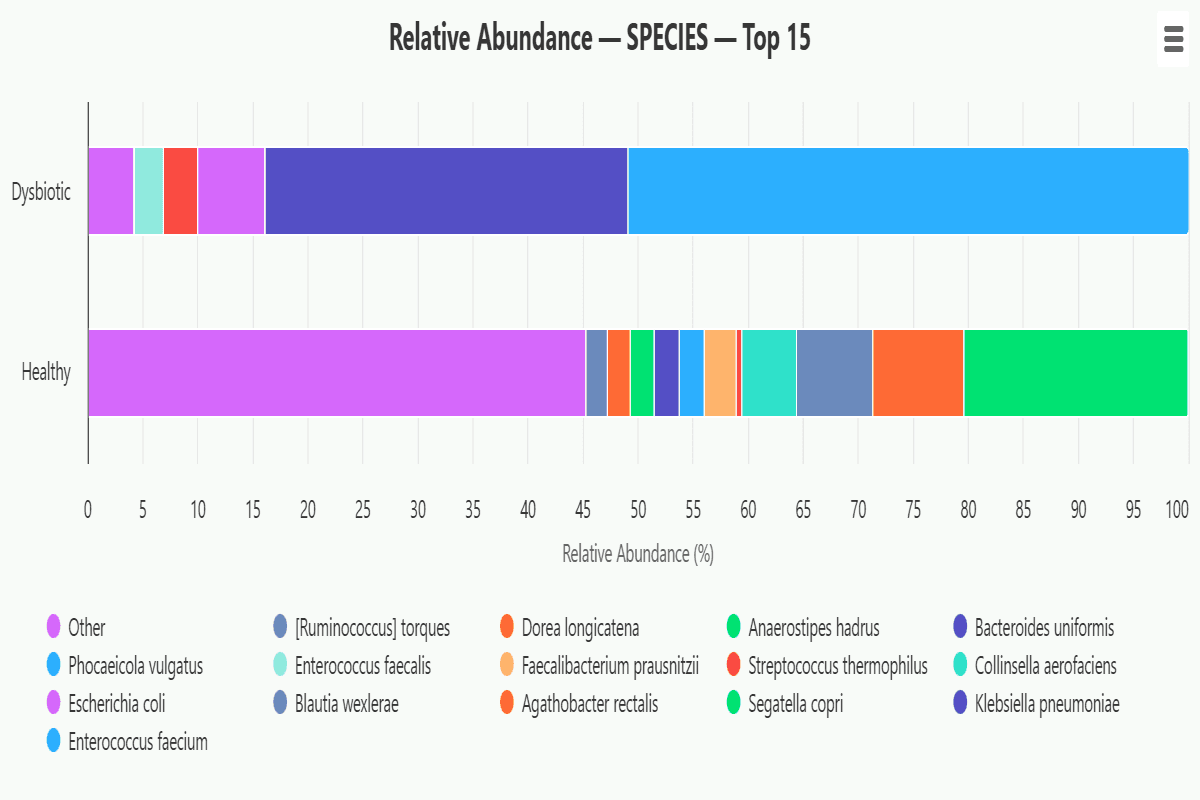
Group Relative Abundance
Group-averaged taxonomic composition as 100% stacked bars at the selected rank.
Kraken style, CLARK, KaijuClassified vs Unclassified by Group
Stacked column chart showing mean classified vs unclassified reads per experimental group with standard deviation.
Kraken style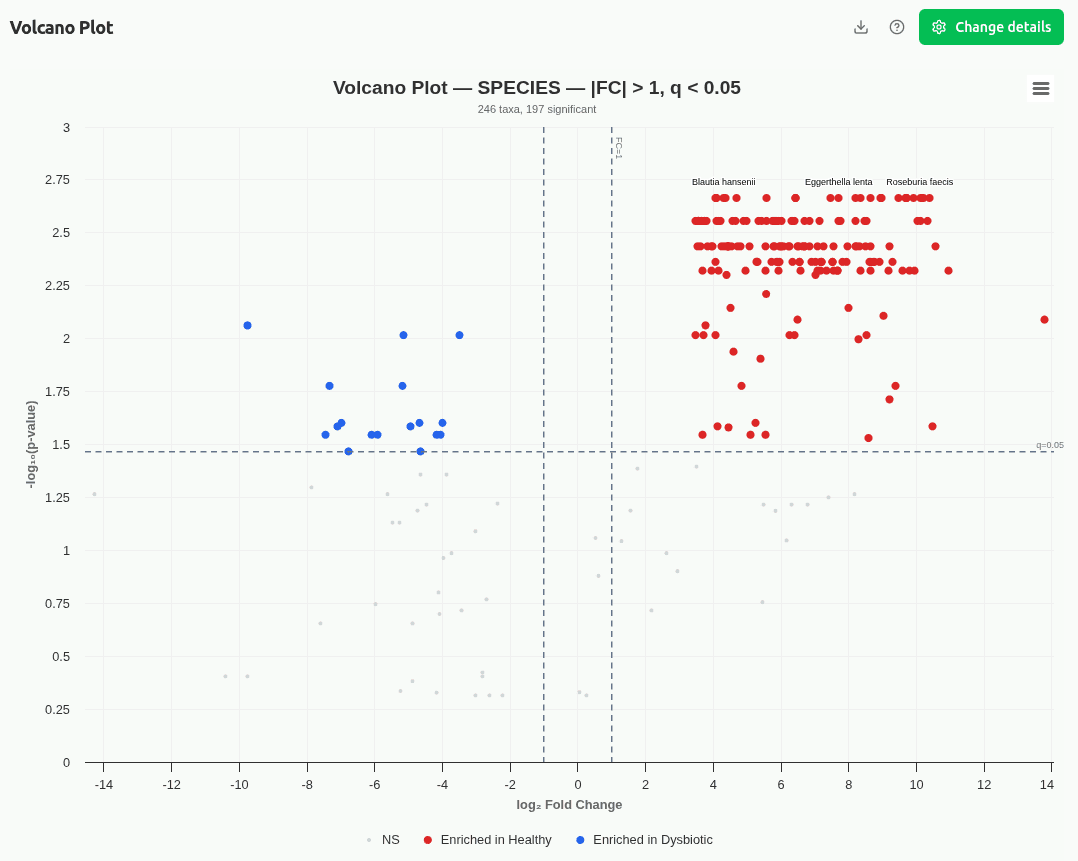
Volcano Plot
Log₂ fold-change vs −log₁₀ adjusted p-value — significantly enriched taxa colored by group.
Kraken style, CLARK, Kaiju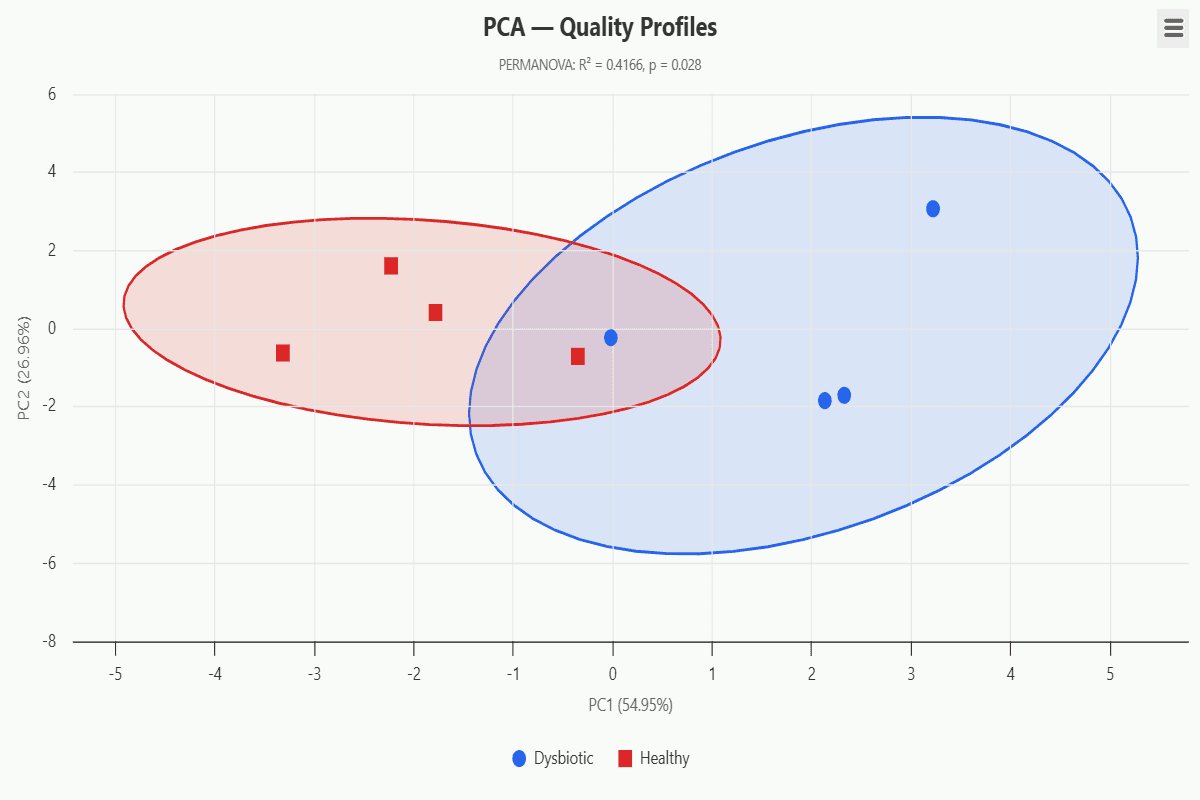
PCA — Quality Profiles
PCA ordination of per-sample quality profiles with PERMANOVA test and 95% confidence ellipses.
CheckM2, DAS Tool, VAMB, SemiBin2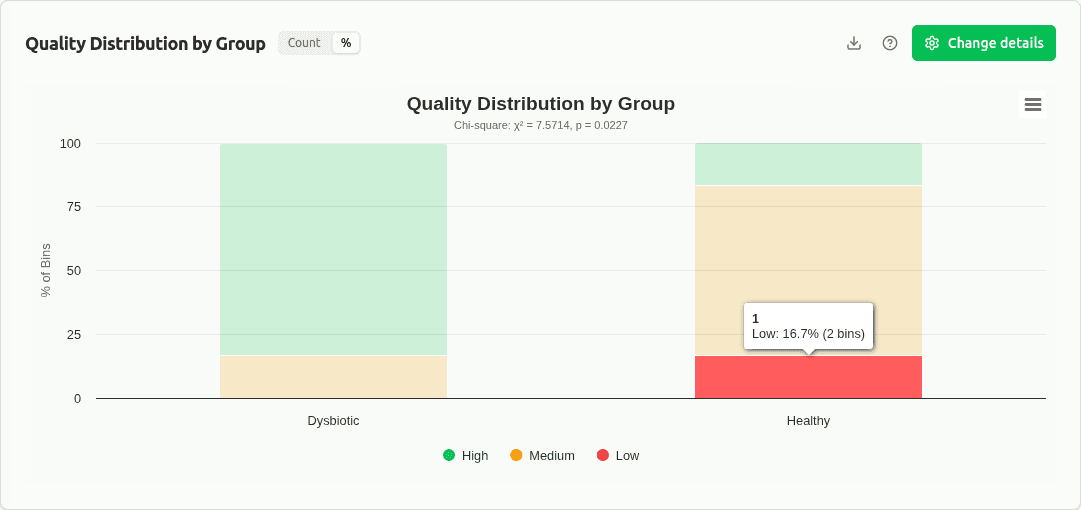
Quality Scatter by Group
Cross-group scatter overlay of quality metrics colored by group with MIMAG tier zones.
CheckM2, DAS Tool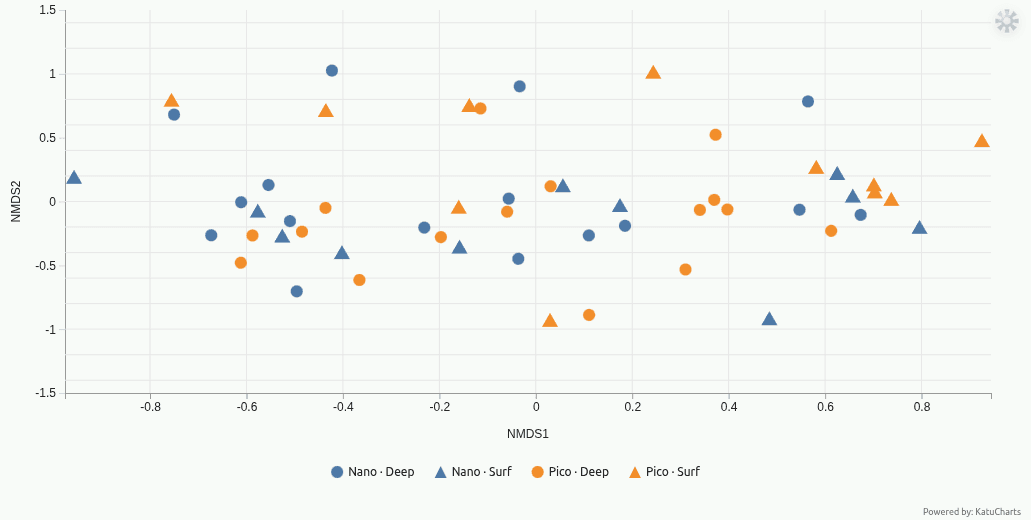
Sample Ordination
NMDS / PCoA of samples on Bray-Curtis distances, coloured and shaped by metadata with confidence ellipses.
MicrobiomeTaxonomic Dependencies
Chord diagram showing lineage relationships between taxa across all classification levels.
Kraken style, CLARK, KaijuRichness by Rank
Number of distinct taxa detected at each taxonomic rank.
Kraken style, CLARK, KaijuRank Abundance (Whittaker)
Taxa ranked by decreasing abundance on log scale — slope indicates evenness.
Kraken style, CLARK, KaijuGenome Size Distribution
Genome size per bin colored by quality tier.
CheckM2Assembly Fragmentation
Contigs vs genome size — fragmented assemblies cluster at high contig counts.
CheckM2Cumulative Genome Recovery
Running total of genome size sorted by quality score — steep rise = high-quality bins dominate.
CheckM2Bin Score Ranking
DAS Tool score based on unique SCGs — bins above 0.5 selected by default.
DAS ToolDAS Tool Heatmap
Bin score, SCG completeness, and redundancy across all bins.
DAS ToolVAMB Genome Size
Genome size distribution with 250 Kbp filtering threshold.
VAMBAverage Contig Length
Fragmentation per cluster — derived from bp / ncontigs.
VAMBSemiBin2 Genome Size
Genome size per bin with quality threshold cutoffs.
SemiBin2L50 vs Number of Contigs
Lower L50 relative to total contigs indicates better assembly.
SemiBin2Abundance Heatmap
Cross-sample heatmap of taxonomic abundance at selected rank.
Kraken style, CLARK, KaijuGenome Size Comparison
Genome size distribution across samples.
CheckM2, DAS Tool, VAMB, SemiBin2Bin Score Distribution
DAS Tool bin score distribution compared across samples.
DAS ToolClassified vs Unclassified
Stacked bars showing classified vs unclassified reads per sample.
Kraken style, CLARK, KaijuQuality % Comparison
100% stacked bars of High/Medium/Low quality proportions per sample.
CheckM2, DAS ToolAlpha Diversity Boxplots
Shannon, Simpson, Richness, and Evenness distributions per group as boxplots with statistical tests.
Kraken style, CLARK, KaijuGroup Relative Abundance
Group-averaged taxonomic composition as 100% stacked bars at the selected rank.
Kraken style, CLARK, KaijuClassified vs Unclassified by Group
Stacked column chart showing mean classified vs unclassified reads per experimental group with standard deviation.
Kraken styleVolcano Plot
Log₂ fold-change vs −log₁₀ adjusted p-value — significantly enriched taxa colored by group.
Kraken style, CLARK, KaijuPCA — Quality Profiles
PCA ordination of per-sample quality profiles with PERMANOVA test and 95% confidence ellipses.
CheckM2, DAS Tool, VAMB, SemiBin2Quality Scatter by Group
Cross-group scatter overlay of quality metrics colored by group with MIMAG tier zones.
CheckM2, DAS ToolSample Ordination
NMDS / PCoA of samples on Bray-Curtis distances, coloured and shaped by metadata with confidence ellipses.
Microbiome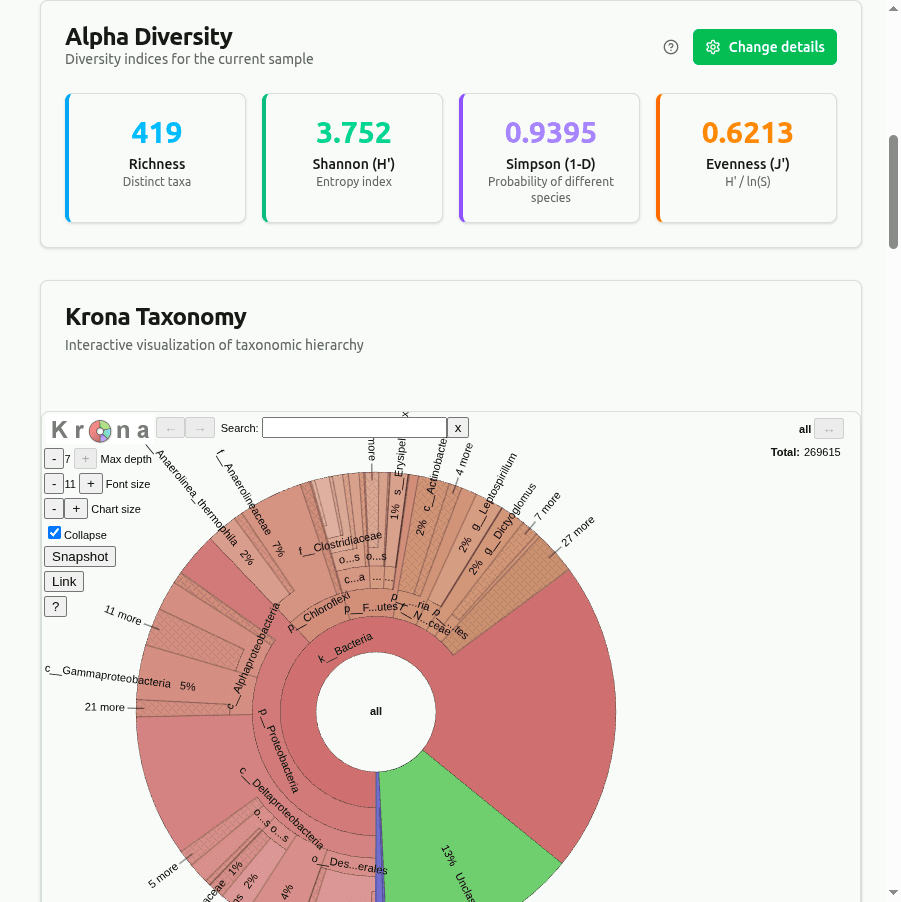
Alpha Diversity
Richness, Shannon, Simpson, and Evenness indices at a glance.
Kraken style, CLARK, Kaiju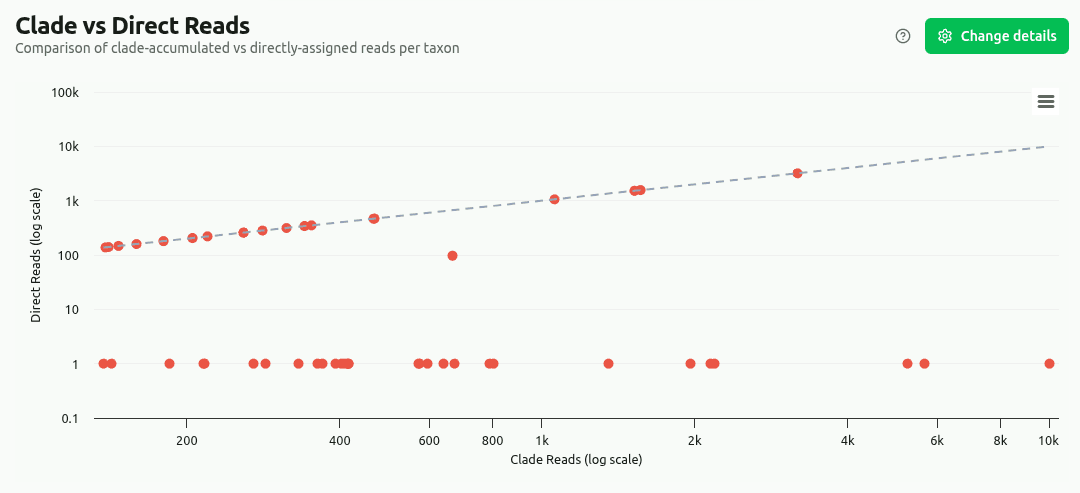
Clade vs Direct Reads
Clade-accumulated vs directly-assigned reads per taxon.
Kraken style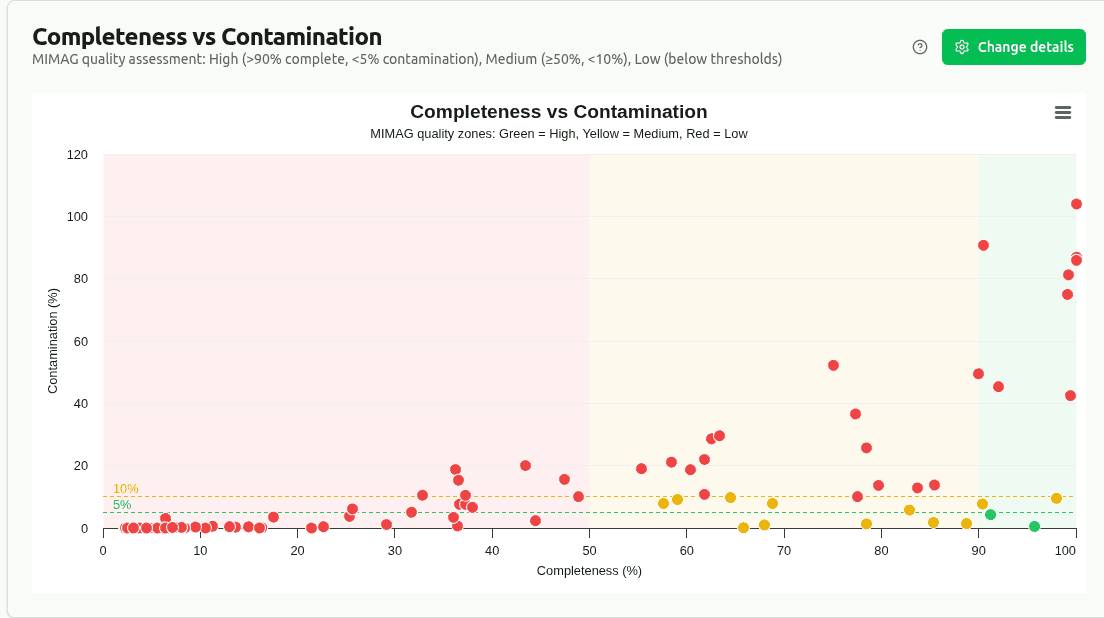
Completeness vs Contamination
MIMAG-standard genome quality assessment — identify high-quality bins with >90% completeness and <5% contamination.
CheckM2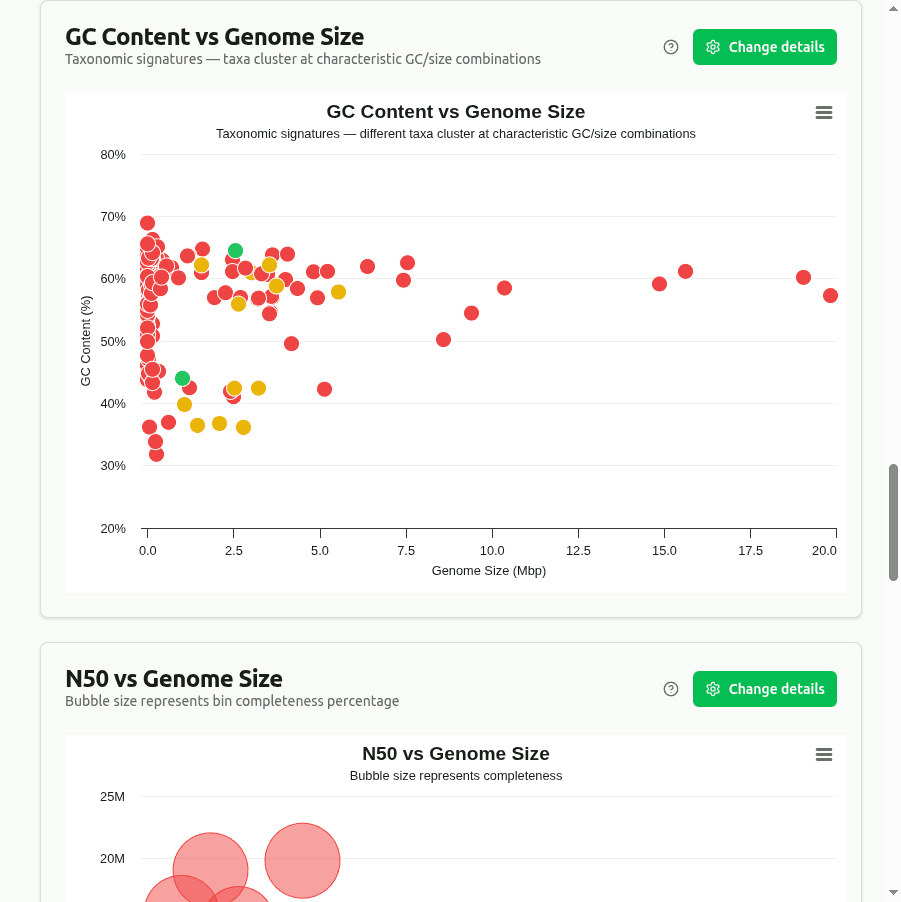
GC Content vs Genome Size
Taxonomic signatures — taxa cluster at characteristic GC/size combinations.
CheckM2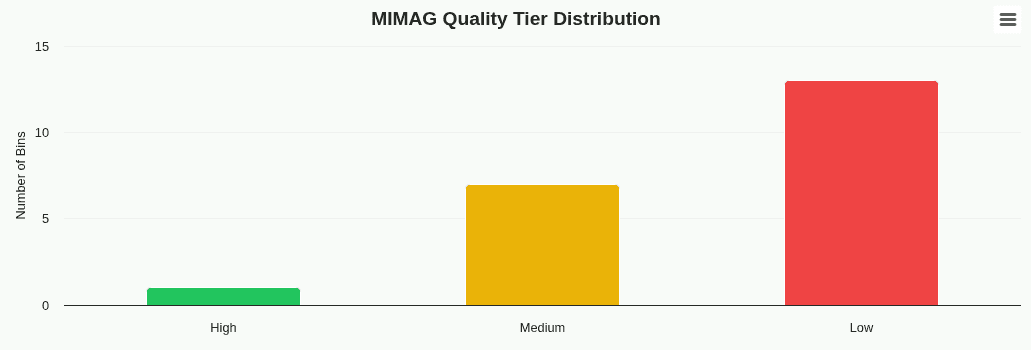
MIMAG Quality Tiers
Bin counts by MIMAG quality tier: High (>90% comp, <5% contam), Medium, Low.
CheckM2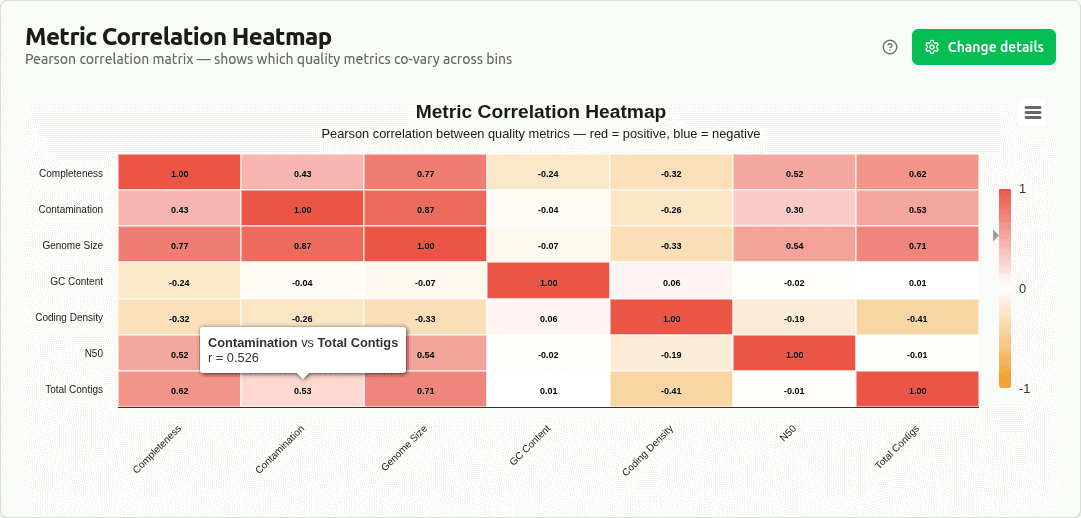
Metric Correlation Heatmap
Pearson correlation matrix across all numeric quality metrics.
CheckM2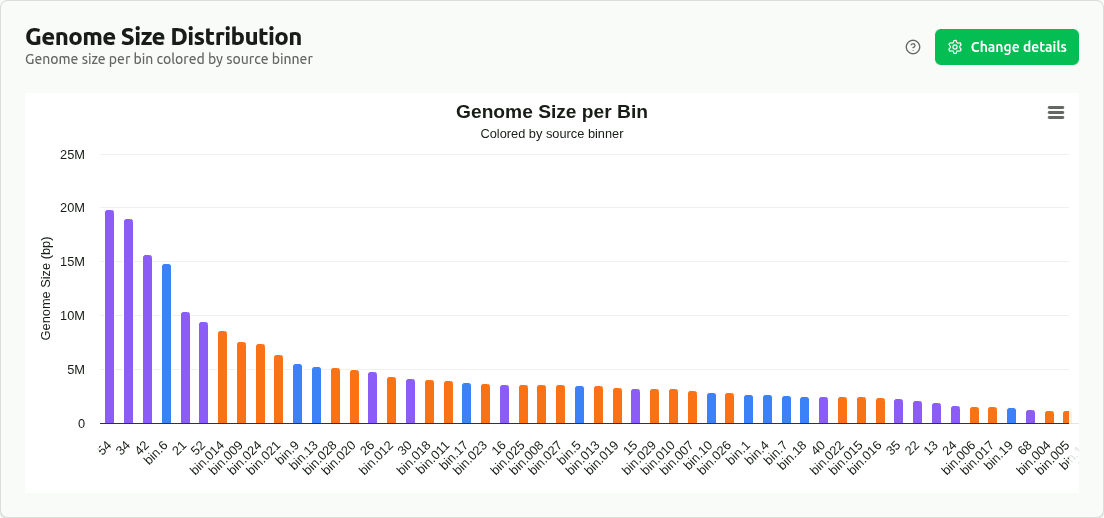
DAS Tool Genome Size
Genome size per bin colored by source binner.
DAS Tool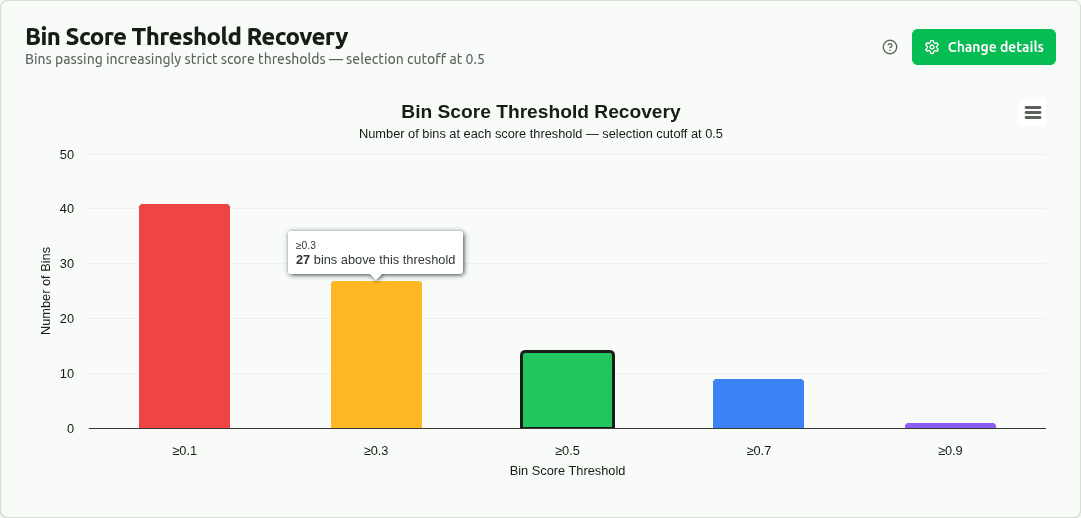
Score Threshold Recovery
Bins passing ≥0.1/≥0.3/≥0.5/≥0.7/≥0.9 bin_score thresholds.
DAS Tool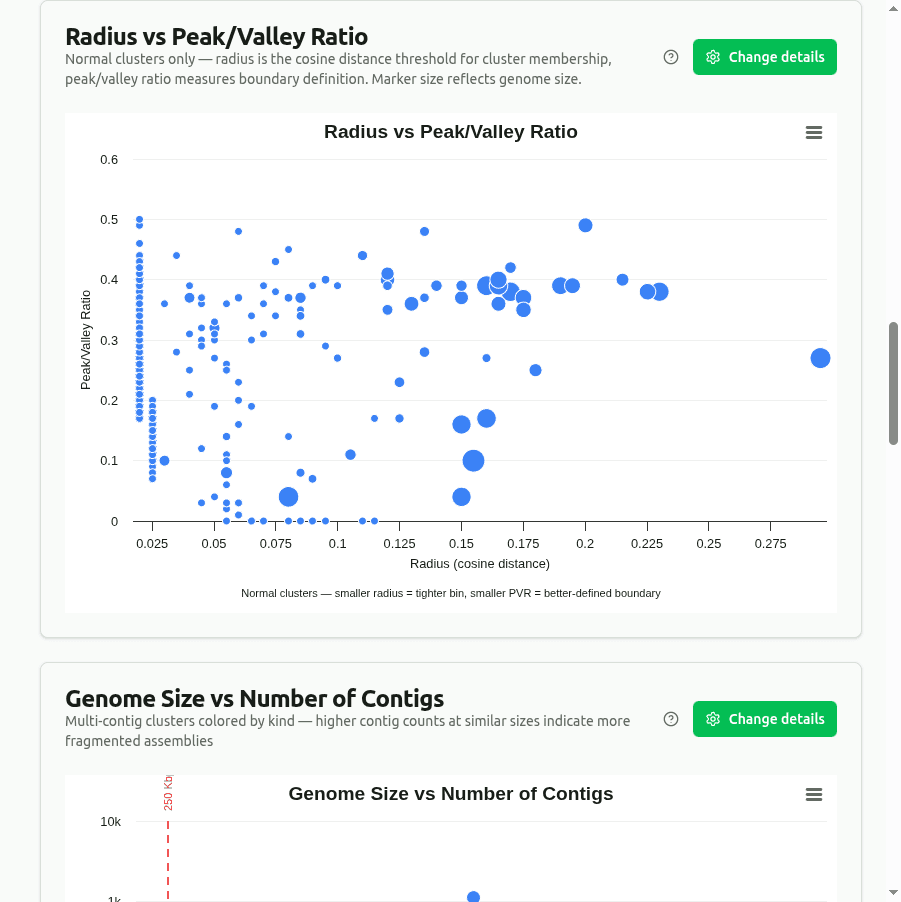
Cluster Radius Analysis
Radius vs peak/valley ratio — marker size reflects genome size.
VAMB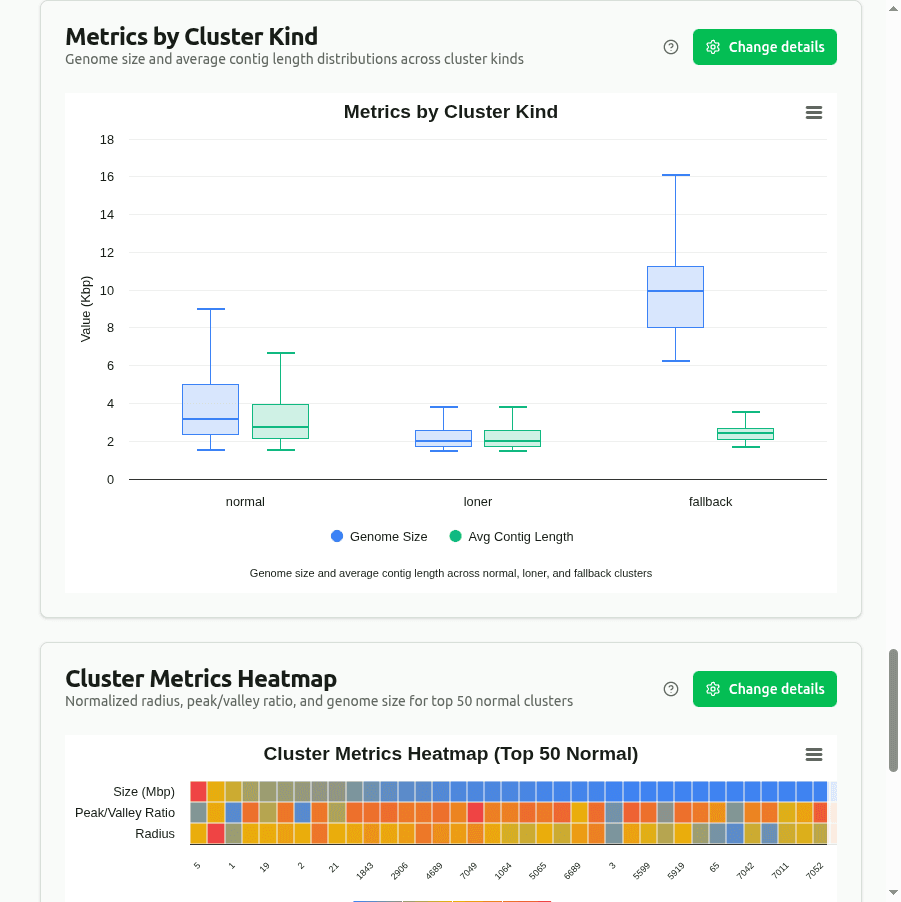
Metrics by Cluster Kind
Genome size and contig length distributions per kind.
VAMB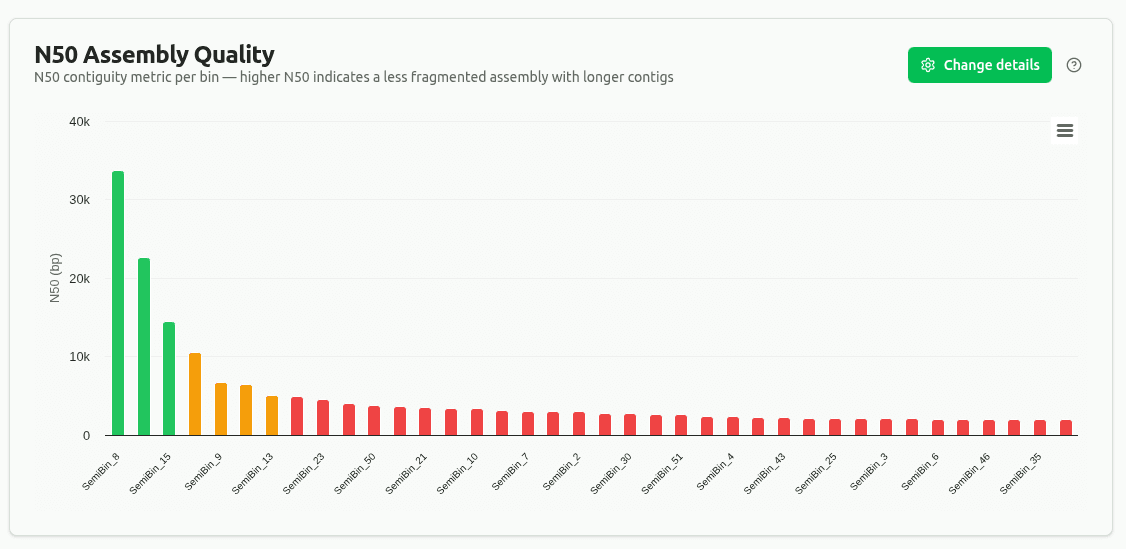
N50 Assembly Quality
N50 contiguity metric per bin — higher N50 means less fragmented assembly.
SemiBin2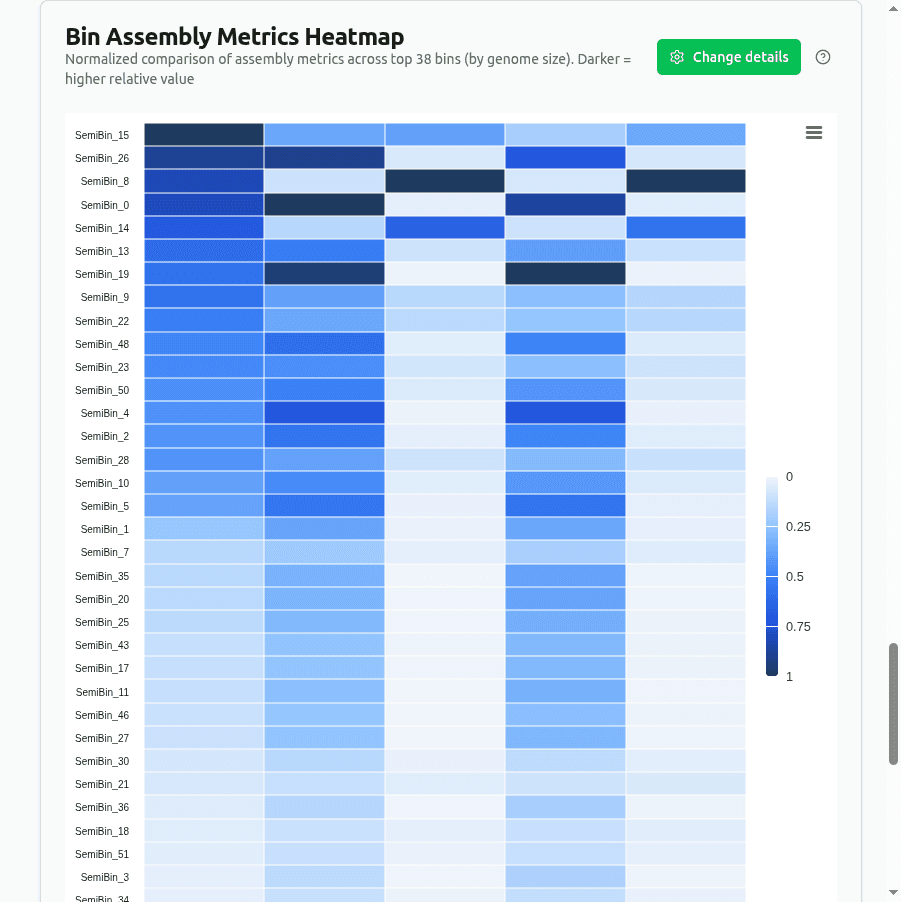
SemiBin2 Heatmap
Normalized assembly metrics across all bins.
SemiBin2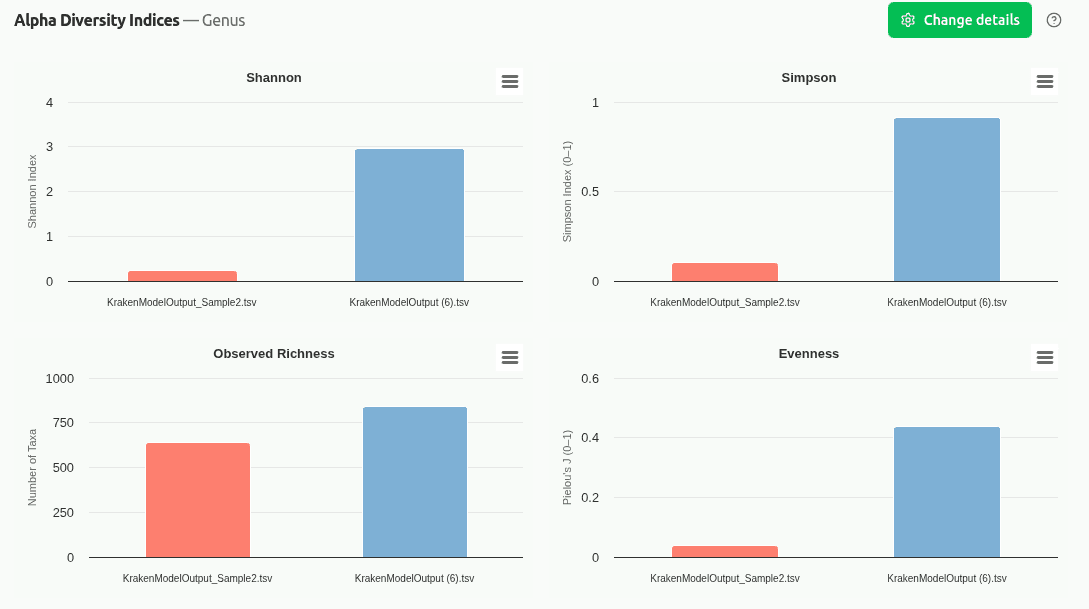
Alpha Diversity Panels
Shannon, Simpson, Observed Richness, and Evenness — each on its own scale.
Kraken style, CLARK, KaijuCompleteness Distribution
Bin completeness distribution compared across samples.
CheckM2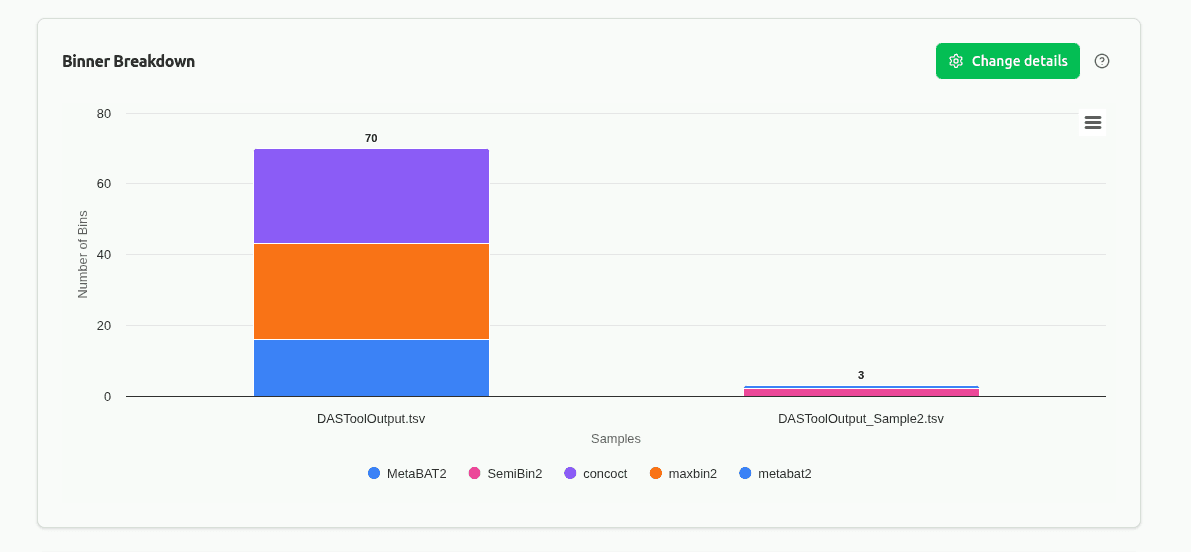
Binner Breakdown
Contribution of each binner (MetaBAT2, MaxBin2, CONCOCT) per sample.
DAS Tool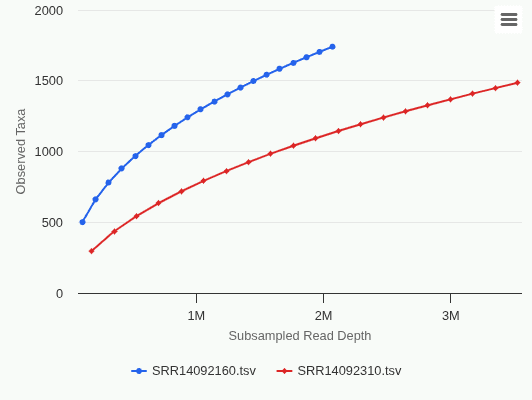
Rarefaction Comparison
Overlaid rarefaction curves for all samples — compare sequencing depth and saturation.
Kraken style, CLARK, Kaiju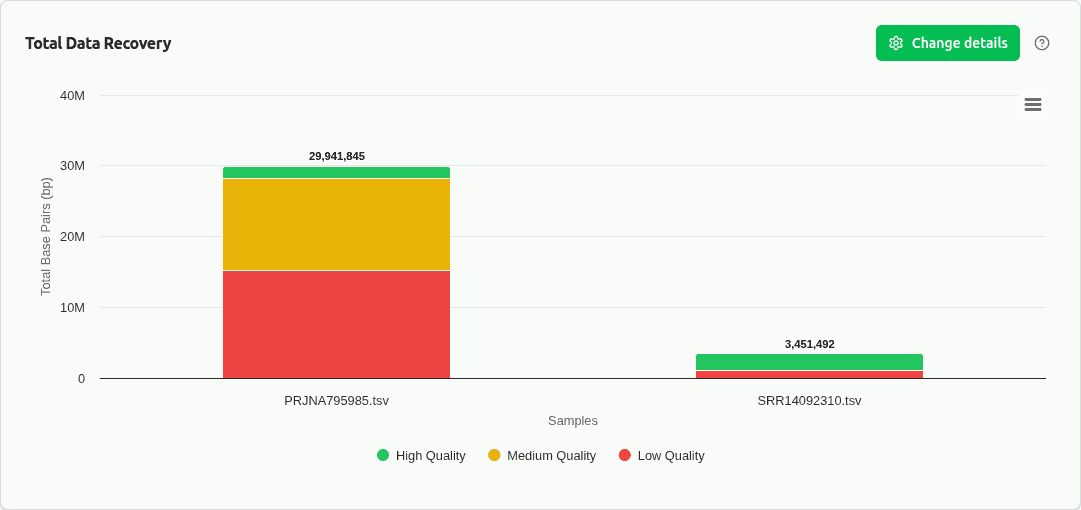
Total Recovery Comparison
Total base pairs recovered per sample split by quality tier.
CheckM2, DAS Tool, VAMB, SemiBin2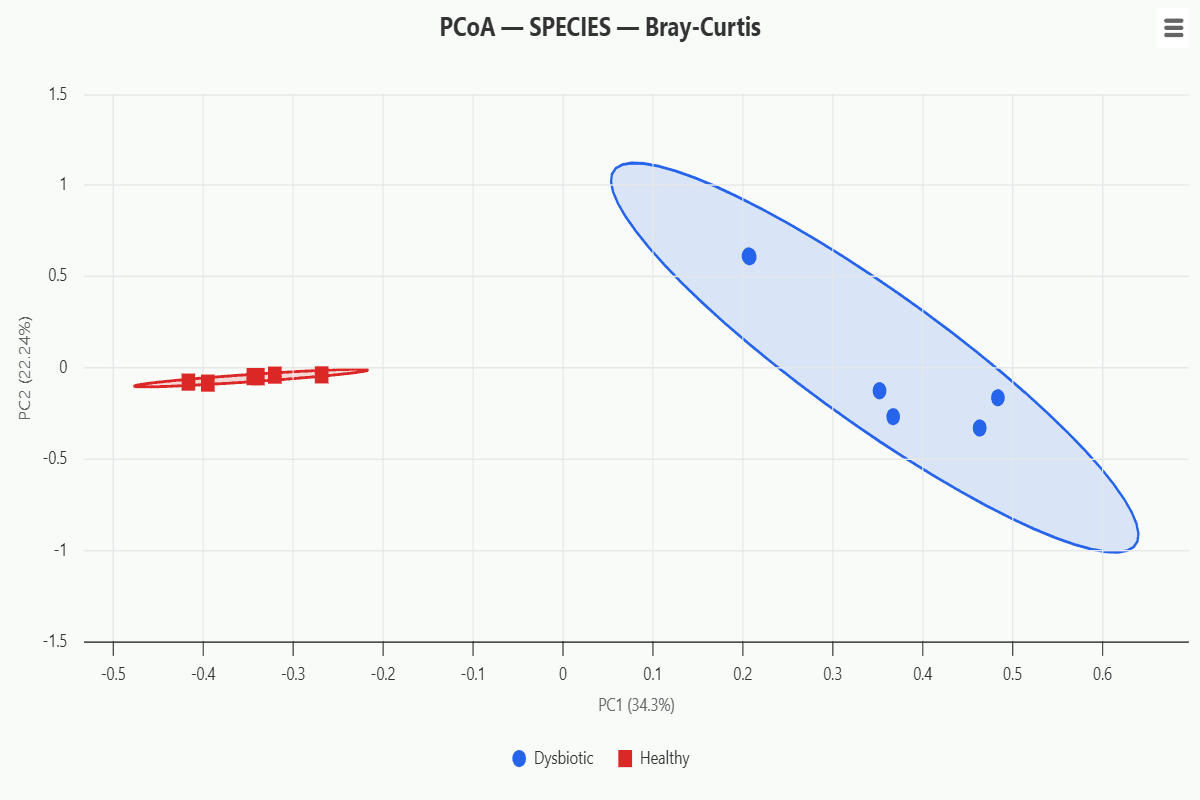
PCoA Ordination
Principal Coordinates Analysis on Bray-Curtis distances with confidence ellipses per group.
Kraken style, CLARK, Kaiju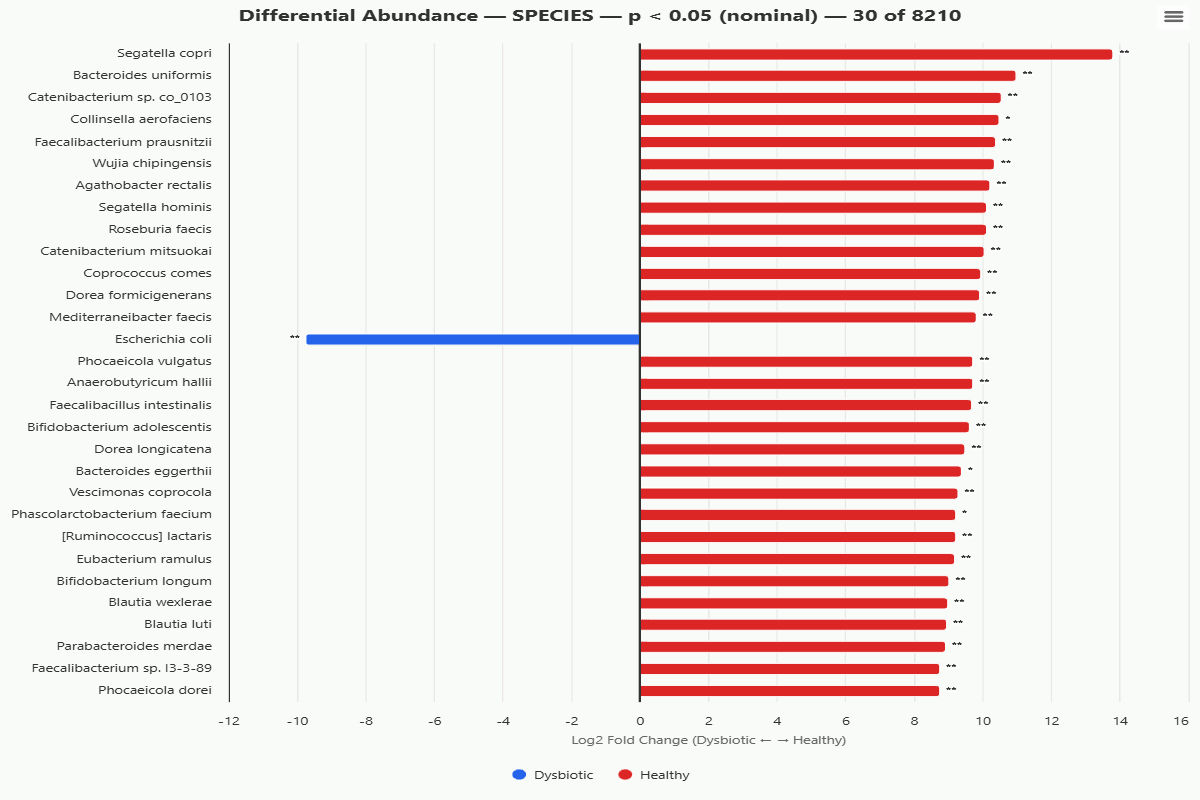
Differential Abundance
Taxa with significant abundance differences between groups via Kruskal-Wallis with FDR correction.
Kraken style, CLARK, KaijuAbundance Distribution by Group
Grouped column chart of mean read counts per taxa at the selected rank, one series per group.
Kraken style, CLARK, Kaiju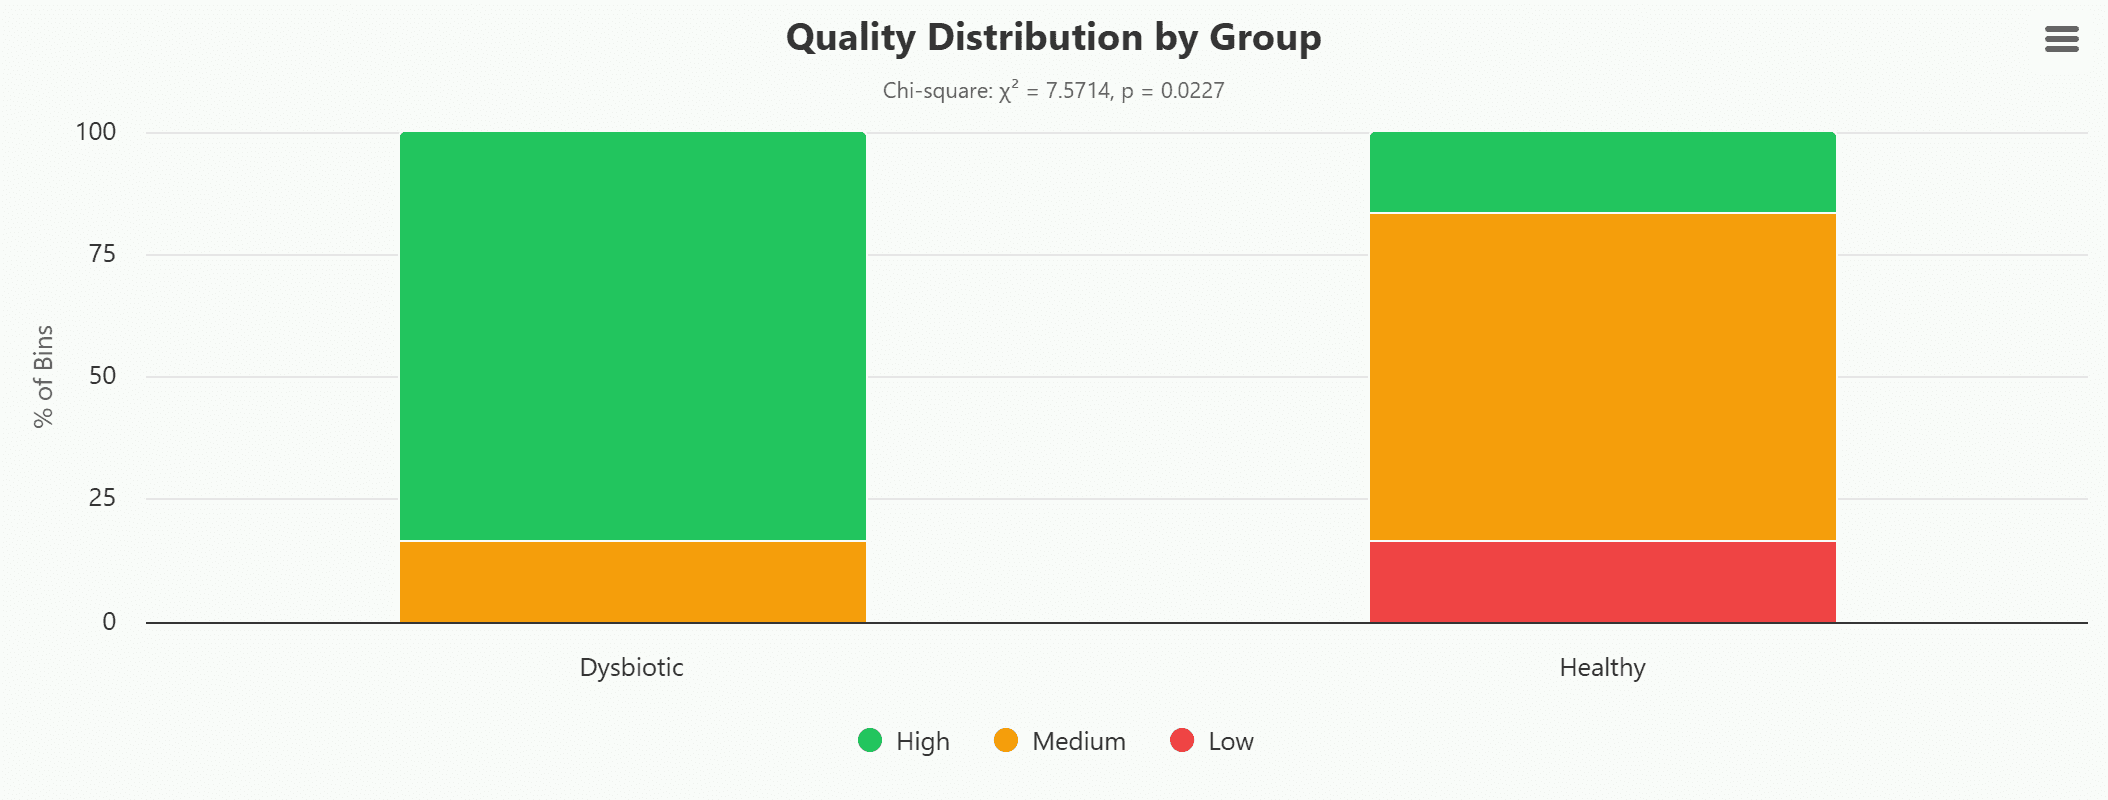
Quality Distribution by Group
Grouped bar chart of quality tier counts per group with Chi-square test for independence.
CheckM2, DAS Tool, VAMB, SemiBin2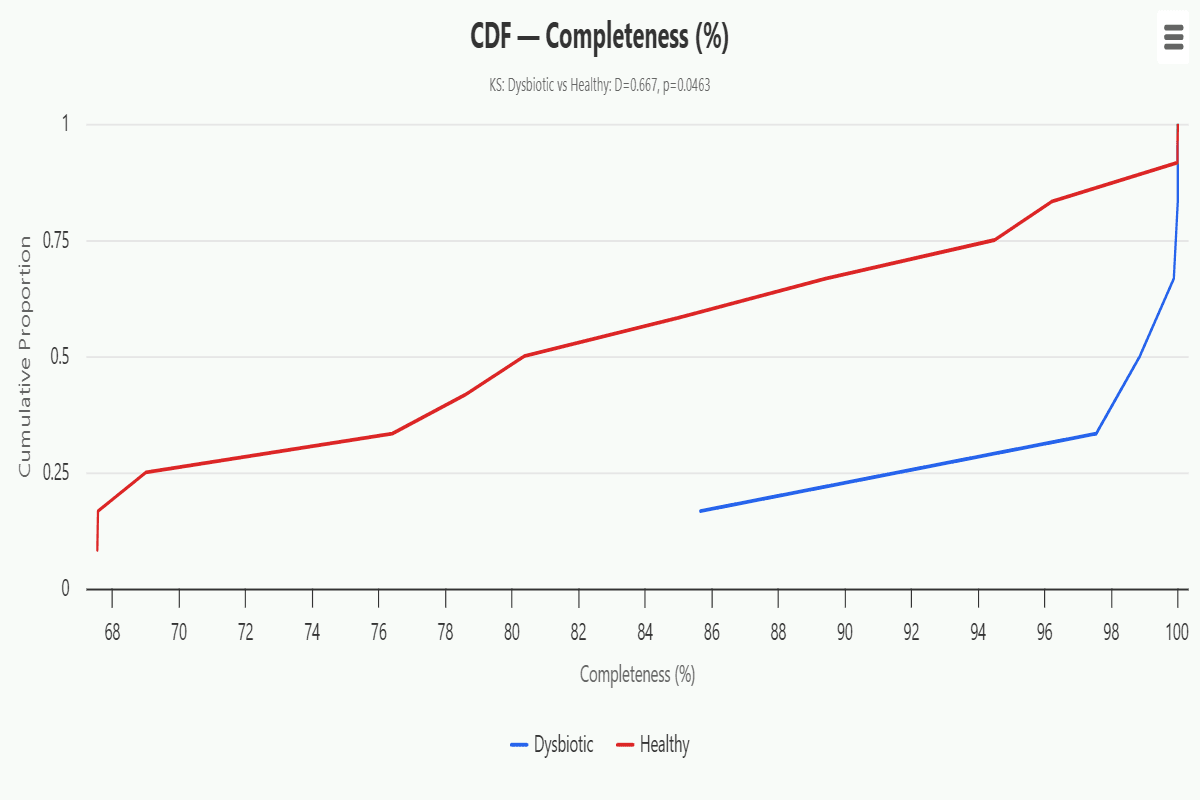
Metric CDF by Group
Overlaid empirical CDFs of a selected metric across groups with Kolmogorov-Smirnov test.
CheckM2, DAS Tool, VAMB, SemiBin2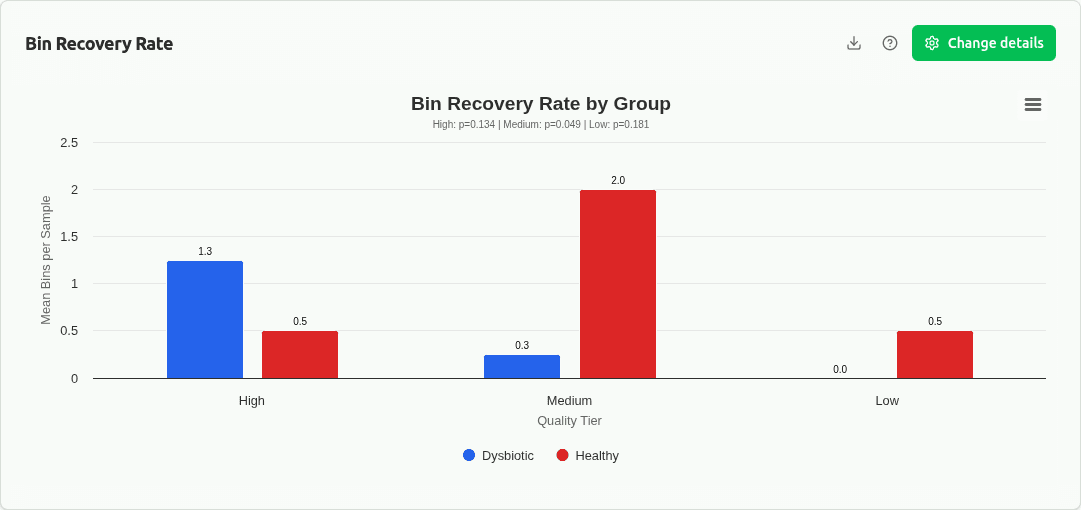
Total Recovery by Group
Mean total base pairs recovered per group split by quality tier with error bars.
CheckM2, DAS Tool, VAMB, SemiBin2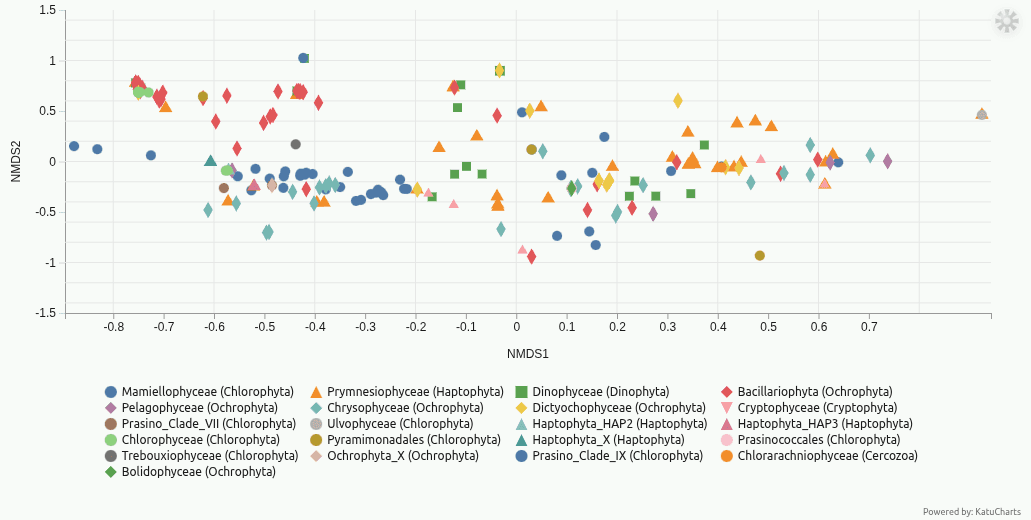
Taxa Ordination
Taxa projected into ordination space, coloured by one rank and shaped by another to show community drivers.
MicrobiomeAlpha Diversity
Richness, Shannon, Simpson, and Evenness indices at a glance.
Kraken style, CLARK, KaijuClade vs Direct Reads
Clade-accumulated vs directly-assigned reads per taxon.
Kraken styleCompleteness vs Contamination
MIMAG-standard genome quality assessment — identify high-quality bins with >90% completeness and <5% contamination.
CheckM2GC Content vs Genome Size
Taxonomic signatures — taxa cluster at characteristic GC/size combinations.
CheckM2MIMAG Quality Tiers
Bin counts by MIMAG quality tier: High (>90% comp, <5% contam), Medium, Low.
CheckM2Metric Correlation Heatmap
Pearson correlation matrix across all numeric quality metrics.
CheckM2DAS Tool Genome Size
Genome size per bin colored by source binner.
DAS ToolScore Threshold Recovery
Bins passing ≥0.1/≥0.3/≥0.5/≥0.7/≥0.9 bin_score thresholds.
DAS ToolCluster Radius Analysis
Radius vs peak/valley ratio — marker size reflects genome size.
VAMBMetrics by Cluster Kind
Genome size and contig length distributions per kind.
VAMBN50 Assembly Quality
N50 contiguity metric per bin — higher N50 means less fragmented assembly.
SemiBin2SemiBin2 Heatmap
Normalized assembly metrics across all bins.
SemiBin2Alpha Diversity Panels
Shannon, Simpson, Observed Richness, and Evenness — each on its own scale.
Kraken style, CLARK, KaijuCompleteness Distribution
Bin completeness distribution compared across samples.
CheckM2Binner Breakdown
Contribution of each binner (MetaBAT2, MaxBin2, CONCOCT) per sample.
DAS ToolRarefaction Comparison
Overlaid rarefaction curves for all samples — compare sequencing depth and saturation.
Kraken style, CLARK, KaijuTotal Recovery Comparison
Total base pairs recovered per sample split by quality tier.
CheckM2, DAS Tool, VAMB, SemiBin2PCoA Ordination
Principal Coordinates Analysis on Bray-Curtis distances with confidence ellipses per group.
Kraken style, CLARK, KaijuDifferential Abundance
Taxa with significant abundance differences between groups via Kruskal-Wallis with FDR correction.
Kraken style, CLARK, KaijuAbundance Distribution by Group
Grouped column chart of mean read counts per taxa at the selected rank, one series per group.
Kraken style, CLARK, KaijuQuality Distribution by Group
Grouped bar chart of quality tier counts per group with Chi-square test for independence.
CheckM2, DAS Tool, VAMB, SemiBin2Metric CDF by Group
Overlaid empirical CDFs of a selected metric across groups with Kolmogorov-Smirnov test.
CheckM2, DAS Tool, VAMB, SemiBin2Total Recovery by Group
Mean total base pairs recovered per group split by quality tier with error bars.
CheckM2, DAS Tool, VAMB, SemiBin2Taxa Ordination
Taxa projected into ordination space, coloured by one rank and shaped by another to show community drivers.
MicrobiomeFast insights
Visualize taxonomic composition, bin quality, and assembly metrics in seconds.
Interactive
Drill down to any taxon or bin, switch levels and palettes, compare across samples.
11 tools supported
Kraken-style classifiers (Kraken, Kraken2, KrakenUniq, Bracken, Centrifuge), CLARK, Kaiju for taxonomy. CheckM2, DAS Tool, VAMB, SemiBin2 for binning.
Reproducible exports
Save charts and raw tables for publication or downstream analysis.
Supported Analysis Pipelines
From taxonomic profiling to genome bin quality — upload outputs from 11 leading tools
Taxonomic Classification
7 toolsMetagenomic Binning
4 toolsCommunity Analysis
1 toolAll 11 analysis pipelines are available with interactive charts, exportable figures, and multi-sample comparison mode.
How It Works
From raw data to publication-ready visualizations in three simple steps
Upload
Drag & drop outputs from any supported tool — Kraken-style reports, CheckM2 quality tables, DAS Tool evaluations, VAMB clusters, or SemiBin2 bins.
Explore
Interactive charts for taxonomy or binning — switch levels, customize palettes, and compare across multiple samples.
Export & Share
Download figures (PNG/SVG), tables (CSV/JSON), and reports (PDF).
Why Choose IntMeta?
Transform outputs from 11 metagenomic tools into clear, interactive visualizations
Compare taxonomic profiles and bin quality across multiple samples side by side
Ready-to-use figures for presentations, publications, and peer review
Export reproducible charts and data tables in multiple formats